Estimated Value: $431,907 - $519,000
--
Bed
2
Baths
1,970
Sq Ft
$243/Sq Ft
Est. Value
About This Home
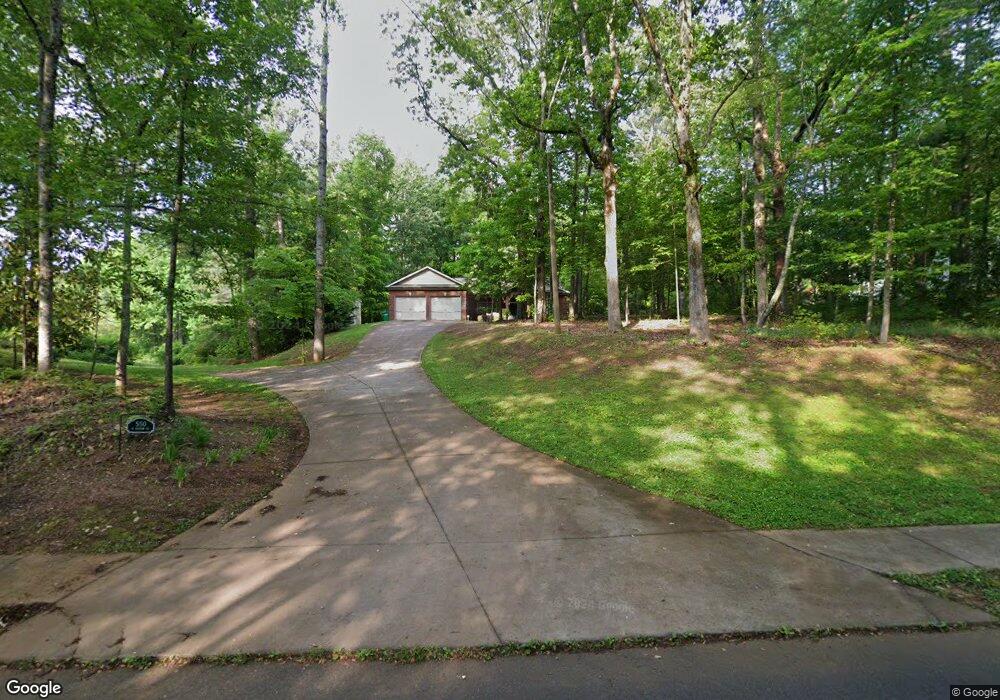
This home is located at 550 N Station St, Tate, GA 30177 and is currently estimated at $478,727, approximately $243 per square foot. 550 N Station St is a home with nearby schools including Tate Elementary School, Pickens County Middle School, and Pickens County High School.
Ownership History
Date
Name
Owned For
Owner Type
Purchase Details
Closed on
Dec 15, 2021
Sold by
Branham Harold Ronald
Bought by
Carney John and Carney Leanne
Current Estimated Value
Purchase Details
Closed on
Feb 14, 2019
Sold by
Oconner Scott
Bought by
Branham Harold Ronald and Branham Debbie Lynn
Home Financials for this Owner
Home Financials are based on the most recent Mortgage that was taken out on this home.
Original Mortgage
$50,000
Interest Rate
4.4%
Mortgage Type
New Conventional
Purchase Details
Closed on
Nov 30, 2016
Sold by
Ray Walter
Bought by
Oconner Tina and Oconner Scott
Create a Home Valuation Report for This Property
The Home Valuation Report is an in-depth analysis detailing your home's value as well as a comparison with similar homes in the area
Home Values in the Area
Average Home Value in this Area
Purchase History
| Date | Buyer | Sale Price | Title Company |
|---|---|---|---|
| Carney John | $10,000 | -- | |
| Branham Harold Ronald | $260,000 | -- | |
| Oconner Tina | -- | -- |
Source: Public Records
Mortgage History
| Date | Status | Borrower | Loan Amount |
|---|---|---|---|
| Previous Owner | Branham Harold Ronald | $50,000 |
Source: Public Records
Tax History Compared to Growth
Tax History
| Year | Tax Paid | Tax Assessment Tax Assessment Total Assessment is a certain percentage of the fair market value that is determined by local assessors to be the total taxable value of land and additions on the property. | Land | Improvement |
|---|---|---|---|---|
| 2024 | $2,878 | $150,416 | $10,401 | $140,015 |
| 2023 | $2,957 | $150,416 | $10,401 | $140,015 |
| 2022 | $2,016 | $104,148 | $10,401 | $93,747 |
| 2021 | $2,176 | $104,865 | $11,118 | $93,747 |
| 2020 | $2,222 | $104,865 | $11,118 | $93,747 |
| 2019 | $2,408 | $104,865 | $11,118 | $93,747 |
| 2018 | $2,288 | $98,707 | $16,678 | $82,029 |
| 2017 | $2,325 | $98,707 | $16,678 | $82,029 |
| 2016 | $403 | $16,856 | $16,856 | $0 |
| 2015 | $394 | $16,856 | $16,856 | $0 |
| 2014 | $395 | $16,856 | $16,856 | $0 |
| 2013 | -- | $16,856 | $16,856 | $0 |
Source: Public Records
Map
Nearby Homes
- 53 Clinic Rd
- 2 Highway 53
- 163 Rabbit Town Rd
- 24 Deerberry Dr
- 49 Bradley Ct
- 194 Deerberry Dr
- 405 Thrasher Ln
- 265 Green School Rd
- 74 Refuge Valley Rd
- 3085 Highway 53 E
- 13 Timberline Dr
- 444 Laiken Dr
- 132 Riverstone Way
- 206 Worley Dr
- 326 Kimberleys Crossing
- 316 Kimberleys Crossing
- 41 Clark Station Rd
- 91 Worley Ct
- 56 Preserve Point
- 3011 Refuge Rd
- 518 N Station St
- 4535 Highway 53 E
- 486 N Station St
- 385 N Railroad St Unit `
- 385 N Railroad St
- 4481 E Church St E
- N N Railroad St
- 466 N Station St
- N N Station St
- 4467 Highway 53 E
- 4467 E Church St E
- 345 N Railroad St
- 14 Clinic Rd
- 442 N Station St
- 430 N Station St
- 44 Stargel St
- 4439 E Church St E
- 420 N Station St
- 311 N Railroad St
- 527 N Railroad St