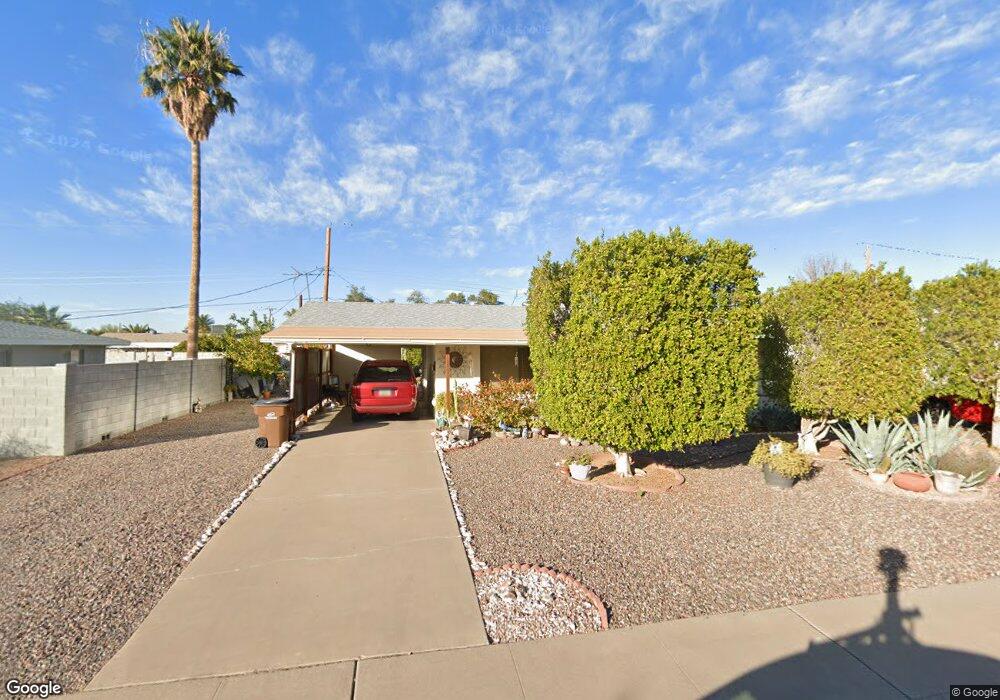
5502 E Casper Rd Mesa, AZ 85205
Central Mesa East NeighborhoodEstimated Value: $227,932 - $270,000
Studio
2
Baths
972
Sq Ft
$264/Sq Ft
Est. Value
About This Home
This home is located at 5502 E Casper Rd, Mesa, AZ 85205 and is currently estimated at $256,983, approximately $264 per square foot. 5502 E Casper Rd is a home located in Maricopa County with nearby schools including O'Connor Elementary School, Franklin at Brimhall Elementary School, and Franklin West Elementary School.
Ownership History
Date
Name
Owned For
Owner Type
Purchase Details
Closed on
Aug 3, 2001
Sold by
Holquin Arthur L
Bought by
Holquin Arthur L and Villalpando Rosa E
Current Estimated Value
Purchase Details
Closed on
Apr 25, 2001
Sold by
Winegart Pauline F and Hallock Patty S
Bought by
Holquin Arthur L
Home Financials for this Owner
Home Financials are based on the most recent Mortgage that was taken out on this home.
Original Mortgage
$76,000
Outstanding Balance
$28,273
Interest Rate
6.98%
Mortgage Type
New Conventional
Estimated Equity
$228,710
Purchase Details
Closed on
May 4, 2000
Sold by
Rabidou Harry L and Rabidou Palma J
Bought by
Winegart Donald W and Winegart Pauline F
Purchase Details
Closed on
Feb 26, 1996
Sold by
Trebil Marjean L
Bought by
Rabidou Harry L and Rabidou Palma J
Home Financials for this Owner
Home Financials are based on the most recent Mortgage that was taken out on this home.
Original Mortgage
$50,400
Interest Rate
5.75%
Mortgage Type
New Conventional
Create a Home Valuation Report for This Property
The Home Valuation Report is an in-depth analysis detailing your home's value as well as a comparison with similar homes in the area
Home Values in the Area
Average Home Value in this Area
Purchase History
| Date | Buyer | Sale Price | Title Company |
|---|---|---|---|
| Holquin Arthur L | -- | -- | |
| Holquin Arthur L | $80,000 | Security Title Agency | |
| Winegart Donald W | $77,000 | Chicago Title Insurance Co | |
| Rabidou Harry L | $63,000 | Transnation Title Ins Co |
Source: Public Records
Mortgage History
| Date | Status | Borrower | Loan Amount |
|---|---|---|---|
| Open | Holquin Arthur L | $76,000 | |
| Previous Owner | Rabidou Harry L | $50,400 |
Source: Public Records
Tax History
| Year | Tax Paid | Tax Assessment Tax Assessment Total Assessment is a certain percentage of the fair market value that is determined by local assessors to be the total taxable value of land and additions on the property. | Land | Improvement |
|---|---|---|---|---|
| 2025 | $809 | $10,103 | -- | -- |
| 2024 | $822 | $9,622 | -- | -- |
| 2023 | $822 | $20,460 | $4,090 | $16,370 |
| 2022 | $802 | $15,630 | $3,120 | $12,510 |
| 2021 | $810 | $13,470 | $2,690 | $10,780 |
| 2020 | $802 | $12,350 | $2,470 | $9,880 |
| 2019 | $747 | $11,480 | $2,290 | $9,190 |
| 2018 | $726 | $10,170 | $2,030 | $8,140 |
| 2017 | $708 | $8,920 | $1,780 | $7,140 |
| 2016 | $630 | $8,330 | $1,660 | $6,670 |
| 2015 | $642 | $7,880 | $1,570 | $6,310 |
Source: Public Records
Map
Nearby Homes
- 5519 E Casper Rd
- 5409 E Decatur St
- 5533 E Decatur St
- 440 N 56th St
- 509 N 53rd Place
- 5422 E Des Moines St
- 5410 E University Dr
- 5627 E Covina Rd
- 5416 E Baltimore St
- 5455 E Baltimore St
- 5325 E Des Moines St
- 5502 E Butte St
- 708 N 56th St
- 5422 E Dodge St
- 5410 E Dodge St
- 5437 E Butte St
- 5331 E Dodge St
- 5502 E Duncan St
- 5714 E Covina Rd
- 5634 E Dodge St
- 5448 E Casper Rd
- 5510 E Casper Rd
- 5501 E Colby St
- 5445 E Colby St
- 5509 E Colby St
- 5501 E Casper Rd
- 5442 E Casper Rd
- 5514 E Casper Rd
- 5449 E Casper Rd
- 5507 E Casper Rd
- 5439 E Colby St
- 5515 E Colby St
- 5443 E Casper Rd
- 5513 E Casper Rd
- 5436 E Casper Rd
- 5520 E Casper Rd
- 5433 E Colby St
- 5521 E Colby St
- 5502 E Covina Rd
- 5437 E Casper Rd
Your Personal Tour Guide
Ask me questions while you tour the home.