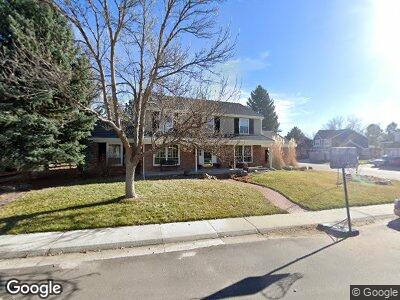
5504 S Hoyt St Littleton, CO 80123
Governor's Ranch NeighborhoodEstimated Value: $848,928 - $947,000
4
Beds
3
Baths
3,624
Sq Ft
$246/Sq Ft
Est. Value
About This Home
This home is located at 5504 S Hoyt St, Littleton, CO 80123 and is currently estimated at $889,982, approximately $245 per square foot. 5504 S Hoyt St is a home located in Jefferson County with nearby schools including Governor's Ranch Elementary School, Ken Caryl Middle School, and Columbine High School.
Ownership History
Date
Name
Owned For
Owner Type
Purchase Details
Closed on
Sep 6, 2023
Sold by
Rikon Shai and Slade Allison A
Bought by
Rikon & Slade Joint Revocable Trust and Rikon
Current Estimated Value
Purchase Details
Closed on
May 27, 2015
Sold by
Sherman David G and Sherman Kathleen M
Bought by
Rikon Shai and Slade Allison A
Home Financials for this Owner
Home Financials are based on the most recent Mortgage that was taken out on this home.
Original Mortgage
$402,400
Interest Rate
3.71%
Mortgage Type
New Conventional
Purchase Details
Closed on
Jun 26, 2008
Sold by
Johnson Kirk K and Johnson Diane D
Bought by
Sherman David G and Sherman Kathleen M
Home Financials for this Owner
Home Financials are based on the most recent Mortgage that was taken out on this home.
Original Mortgage
$373,500
Interest Rate
6.05%
Mortgage Type
Purchase Money Mortgage
Create a Home Valuation Report for This Property
The Home Valuation Report is an in-depth analysis detailing your home's value as well as a comparison with similar homes in the area
Home Values in the Area
Average Home Value in this Area
Purchase History
| Date | Buyer | Sale Price | Title Company |
|---|---|---|---|
| Rikon & Slade Joint Revocable Trust | -- | None Listed On Document | |
| Rikon Shai | $515,000 | Fidelity National Title Ins | |
| Sherman David G | $467,000 | Landamerica |
Source: Public Records
Mortgage History
| Date | Status | Borrower | Loan Amount |
|---|---|---|---|
| Previous Owner | Rikon Shai | $377,750 | |
| Previous Owner | Rikon Shai | $402,400 | |
| Previous Owner | Sherman David G | $357,443 | |
| Previous Owner | Sherman David G | $373,500 | |
| Previous Owner | Concrete Technologies Inc | $50,000 | |
| Previous Owner | Johnson Kirk K | $50,000 |
Source: Public Records
Tax History Compared to Growth
Tax History
| Year | Tax Paid | Tax Assessment Tax Assessment Total Assessment is a certain percentage of the fair market value that is determined by local assessors to be the total taxable value of land and additions on the property. | Land | Improvement |
|---|---|---|---|---|
| 2024 | $4,726 | $48,251 | $17,555 | $30,696 |
| 2023 | $4,726 | $48,251 | $17,555 | $30,696 |
| 2022 | $4,362 | $43,725 | $16,525 | $27,200 |
| 2021 | $4,418 | $44,984 | $17,001 | $27,983 |
| 2020 | $4,035 | $41,188 | $14,795 | $26,393 |
| 2019 | $3,985 | $41,188 | $14,795 | $26,393 |
| 2018 | $3,628 | $36,207 | $12,053 | $24,154 |
| 2017 | $3,311 | $36,207 | $12,053 | $24,154 |
| 2016 | $3,028 | $31,945 | $10,771 | $21,174 |
| 2015 | $2,998 | $31,945 | $10,771 | $21,174 |
| 2014 | $2,998 | $29,663 | $9,254 | $20,409 |
Source: Public Records
Map
Nearby Homes
- 5426 S Independence St
- 5490 S Jellison St
- 9867 W Berry Dr
- 5723 S Everett Way
- 5454 S Everett Ct
- 5316 S Jellison St
- 9684 W Long Dr
- 10220 W Montgomery Ave
- 10102 W Ida Ave Unit 214
- 9502 W Hialeah Place
- 5225 S Everett Ct
- 8705 W Berry Ave Unit 204
- 8775 W Berry Ave Unit 203
- 8615 W Berry Ave Unit 203
- 8615 W Berry Ave Unit 204
- 8775 W Berry Ave Unit 101
- 5455 S Dover St Unit 102
- 5455 S Dover St Unit 101
- 9391 W Hialeah Place
- 8896 W Prentice Ave
- 5504 S Hoyt St
- 5494 S Hoyt St
- 5493 S Holland St
- 5483 S Holland St
- 9512 W Brandt Place
- 5484 S Hoyt St
- 5473 S Holland St
- 5505 S Hoyt St
- 5495 S Hoyt St
- 9532 W Brandt Place
- 9472 W Brandt Place
- 5485 S Hoyt St
- 5463 S Holland St
- 5474 S Hoyt St
- 9442 W Brandt Place
- 9552 W Brandt Place
- 5492 S Holland St
- 5482 S Holland St
- 5496 S Independence St
- 5486 S Independence St