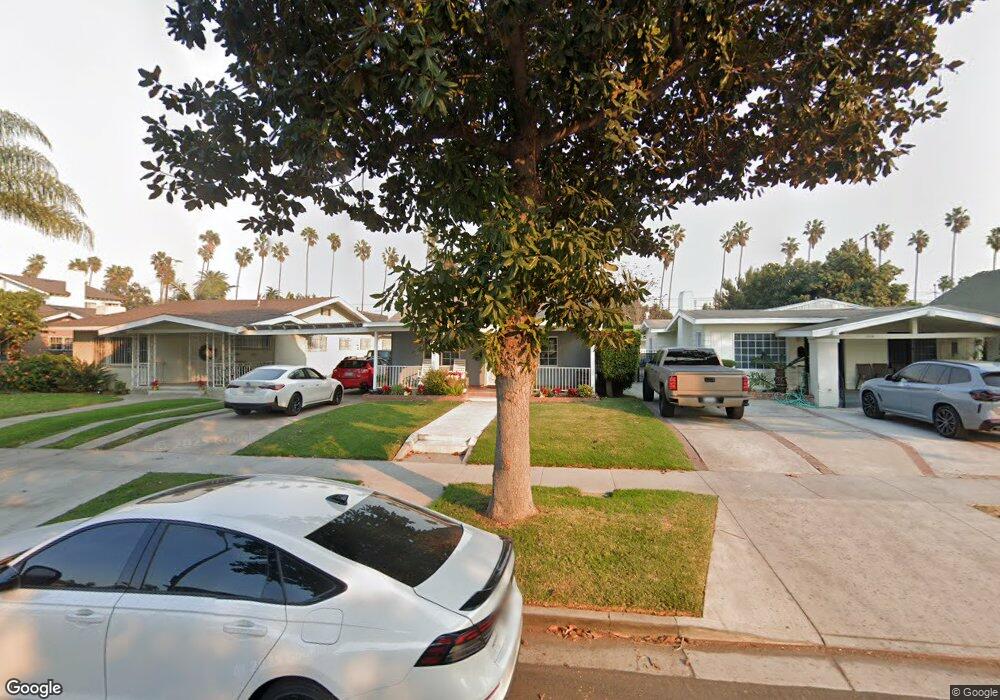
5510 S St Andrews Place Los Angeles, CA 90062
Chesterfield Square NeighborhoodEstimated Value: $682,000 - $798,000
3
Beds
1
Bath
1,417
Sq Ft
$525/Sq Ft
Est. Value
About This Home
This home is located at 5510 S St Andrews Place, Los Angeles, CA 90062 and is currently estimated at $743,524, approximately $524 per square foot. 5510 S St Andrews Place is a home located in Los Angeles County with nearby schools including Western Avenue Technology Magnet, Angeles Mesa Elementary School, and Horace Mann Ucla Community.
Ownership History
Date
Name
Owned For
Owner Type
Purchase Details
Closed on
Oct 20, 2006
Sold by
Moncada Yolanda
Bought by
Davila Antonio
Current Estimated Value
Home Financials for this Owner
Home Financials are based on the most recent Mortgage that was taken out on this home.
Original Mortgage
$384,000
Outstanding Balance
$226,470
Interest Rate
6.25%
Mortgage Type
Purchase Money Mortgage
Estimated Equity
$517,054
Purchase Details
Closed on
Jan 28, 2005
Sold by
Sparrow Suzette
Bought by
Moncada Yolanda
Home Financials for this Owner
Home Financials are based on the most recent Mortgage that was taken out on this home.
Original Mortgage
$288,000
Interest Rate
6.25%
Mortgage Type
Purchase Money Mortgage
Purchase Details
Closed on
Aug 21, 2003
Sold by
Draquez Wilfida M
Bought by
Sparrow Suzette
Home Financials for this Owner
Home Financials are based on the most recent Mortgage that was taken out on this home.
Original Mortgage
$220,000
Interest Rate
6.06%
Mortgage Type
Purchase Money Mortgage
Create a Home Valuation Report for This Property
The Home Valuation Report is an in-depth analysis detailing your home's value as well as a comparison with similar homes in the area
Home Values in the Area
Average Home Value in this Area
Purchase History
| Date | Buyer | Sale Price | Title Company |
|---|---|---|---|
| Davila Antonio | -- | North American Title | |
| Moncada Yolanda | $360,000 | Fidelity National Title Co | |
| Sparrow Suzette | $220,000 | Fidelity National Title |
Source: Public Records
Mortgage History
| Date | Status | Borrower | Loan Amount |
|---|---|---|---|
| Open | Davila Antonio | $384,000 | |
| Closed | Moncada Yolanda | $288,000 | |
| Previous Owner | Sparrow Suzette | $220,000 | |
| Closed | Moncada Yolanda | $72,000 |
Source: Public Records
Tax History Compared to Growth
Tax History
| Year | Tax Paid | Tax Assessment Tax Assessment Total Assessment is a certain percentage of the fair market value that is determined by local assessors to be the total taxable value of land and additions on the property. | Land | Improvement |
|---|---|---|---|---|
| 2025 | $6,135 | $501,793 | $401,439 | $100,354 |
| 2024 | $6,135 | $491,955 | $393,568 | $98,387 |
| 2023 | $6,022 | $482,309 | $385,851 | $96,458 |
| 2022 | $5,749 | $472,853 | $378,286 | $94,567 |
| 2021 | $5,672 | $463,582 | $370,869 | $92,713 |
| 2019 | $5,504 | $449,834 | $359,870 | $89,964 |
| 2018 | $5,399 | $441,014 | $352,814 | $88,200 |
| 2016 | $4,371 | $358,000 | $285,000 | $73,000 |
| 2015 | $3,918 | $320,000 | $255,000 | $65,000 |
| 2014 | $3,491 | $277,000 | $221,000 | $56,000 |
Source: Public Records
Map
Nearby Homes
- 5507 S Manhattan Place
- 5600 S Manhattan Place
- 5718 S Manhattan Place
- 5735 S St Andrews Place
- 5302 S Manhattan Place
- 5718 S Western Ave
- 1739 W 53rd St
- 1664 W 55th St
- 5166 S Manhattan Place
- 5162 S Manhattan Place
- 2070 W 54th St
- 2074 W 54th St
- 5743 S Wilton Place
- 5167 S Gramercy Place
- 1630 W 54th St
- 1625 W 55th St
- 5424 S Van Ness Ave
- 5171 S Wilton Place
- 1613 W 56th St
- 1729 W 51st Place
- 5506 S St Andrews Place
- 5514 S St Andrews Place
- 5502 S St Andrews Place
- 5518 S St Andrews Place
- 5522 S St Andrews Place
- 5430 S St Andrews Place
- 5511 S Manhattan Place
- 5515 S Manhattan Place
- 5526 S St Andrews Place
- 5424 S St Andrews Place
- 5424 5426 S Saint Andrews Place
- 5424 Saint Andrews Place
- 5519 S Manhattan Place
- 5503 S Manhattan Place
- 5509 S Manhattan Place Unit A
- 5509 S Manhattan Place
- 5511 S Saint Andrews Place
- 5523 S Manhattan Place
- 5431 S Manhattan Place
- 5511 S St Andrews Place