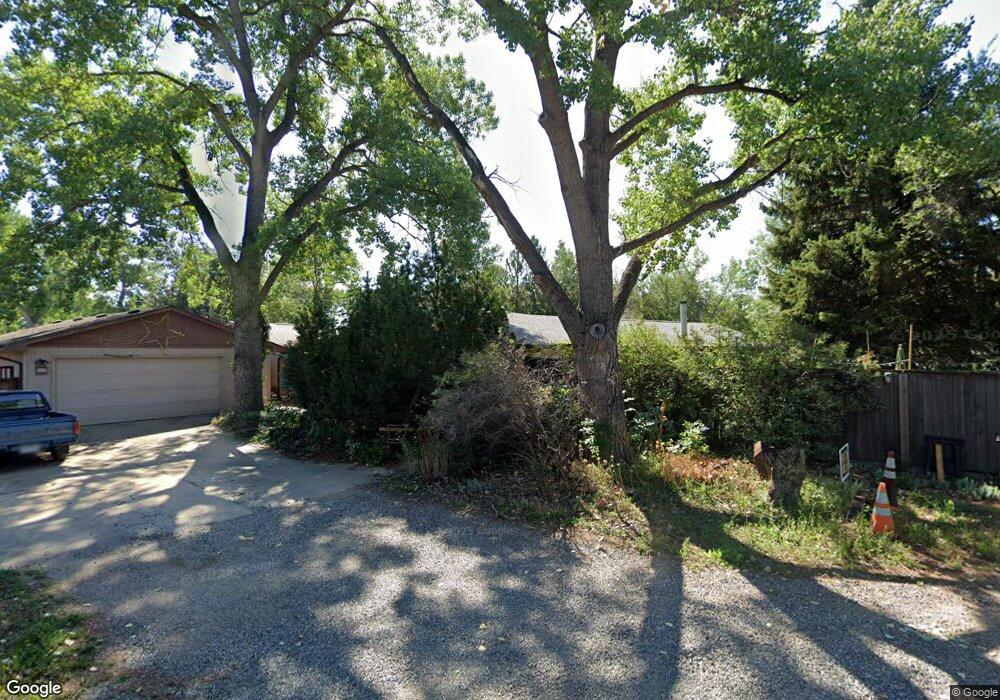
5520 Scenic View Ct Boulder, CO 80303
Southeast Boulder NeighborhoodEstimated Value: $1,308,000 - $1,855,000
2
Beds
4
Baths
3,387
Sq Ft
$459/Sq Ft
Est. Value
About This Home
This home is located at 5520 Scenic View Ct, Boulder, CO 80303 and is currently estimated at $1,553,895, approximately $458 per square foot. 5520 Scenic View Ct is a home located in Boulder County with nearby schools including Eisenhower Elementary School, Manhattan Middle School of the Arts & Academics, and Fairview High School.
Ownership History
Date
Name
Owned For
Owner Type
Purchase Details
Closed on
Oct 8, 2009
Sold by
Greco Anthony Charles
Bought by
Greco Anthony Charles
Current Estimated Value
Home Financials for this Owner
Home Financials are based on the most recent Mortgage that was taken out on this home.
Original Mortgage
$938,250
Outstanding Balance
$613,288
Interest Rate
5.1%
Mortgage Type
Reverse Mortgage Home Equity Conversion Mortgage
Estimated Equity
$940,607
Purchase Details
Closed on
Jul 22, 1999
Sold by
Greco Anthony Charles
Bought by
City Of Boulder
Purchase Details
Closed on
Dec 16, 1997
Sold by
Fisher Kenneth W and Fisher Judy T
Bought by
Greco Anthony Charles
Home Financials for this Owner
Home Financials are based on the most recent Mortgage that was taken out on this home.
Original Mortgage
$303,200
Interest Rate
7.37%
Create a Home Valuation Report for This Property
The Home Valuation Report is an in-depth analysis detailing your home's value as well as a comparison with similar homes in the area
Home Values in the Area
Average Home Value in this Area
Purchase History
| Date | Buyer | Sale Price | Title Company |
|---|---|---|---|
| Greco Anthony Charles | -- | Utc Colorado | |
| City Of Boulder | -- | -- | |
| Greco Anthony Charles | $379,000 | -- |
Source: Public Records
Mortgage History
| Date | Status | Borrower | Loan Amount |
|---|---|---|---|
| Open | Greco Anthony Charles | $938,250 | |
| Previous Owner | Greco Anthony Charles | $303,200 |
Source: Public Records
Tax History Compared to Growth
Tax History
| Year | Tax Paid | Tax Assessment Tax Assessment Total Assessment is a certain percentage of the fair market value that is determined by local assessors to be the total taxable value of land and additions on the property. | Land | Improvement |
|---|---|---|---|---|
| 2025 | $7,066 | $101,300 | $53,344 | $47,956 |
| 2024 | $7,066 | $101,300 | $53,344 | $47,956 |
| 2023 | $6,943 | $87,100 | $34,210 | $56,575 |
| 2022 | $6,628 | $78,327 | $28,412 | $49,915 |
| 2021 | $6,320 | $80,580 | $29,229 | $51,351 |
| 2020 | $5,489 | $70,206 | $26,527 | $43,679 |
| 2019 | $5,405 | $70,206 | $26,527 | $43,679 |
| 2018 | $4,528 | $59,429 | $22,032 | $37,397 |
| 2017 | $4,387 | $65,702 | $24,358 | $41,344 |
| 2016 | $4,266 | $57,240 | $32,397 | $24,843 |
| 2015 | $4,692 | $46,717 | $30,089 | $16,628 |
| 2014 | $3,928 | $46,717 | $30,089 | $16,628 |
Source: Public Records
Map
Nearby Homes
- 1533 Old Tale Rd
- 853 Racquet Ln
- 1209 Harrison Ct
- 1047 Cherryvale Rd
- 819 Gapter Rd
- 655 Cree Cir
- 695 Manhattan Dr Unit 109
- 695 Manhattan Dr Unit 219
- 6137 Baseline Rd
- 645 Manhattan Place Unit 302
- 645 Manhattan Place Unit 304
- 625 Manhattan Place Unit 308
- 4630 Talbot Dr
- 1169 Monroe Dr Unit B
- 500 Manhattan Dr Unit B1
- 4500 Baseline Rd Unit 3302
- 4500 Baseline Rd Unit 4104
- 4500 Baseline Rd Unit 2107
- 4415 Laguna Place Unit 201
- 880 Gilpin Dr
- 5535 Scenic View Ct
- 1430 55th (Sits Back)
- 1430 55th St
- 1460 55th St Unit 1468
- 1460 55th St Unit 2
- 1468 55th St Unit 1
- 1468 55th St
- 1422 55th St
- 1486 Tobys Ln
- 1488 Tobys Ln
- 1482 Tobys Ln
- 1487 Tobys Ln
- 1480 Tobys Ln
- 1485 Tobys Ln
- 5510 Scenic View Ct
- 1402 55th St
- 1483 Tobys Ln
- 1480 55th St
- 1481 Tobys Ln
- 1494 Lodge Ct