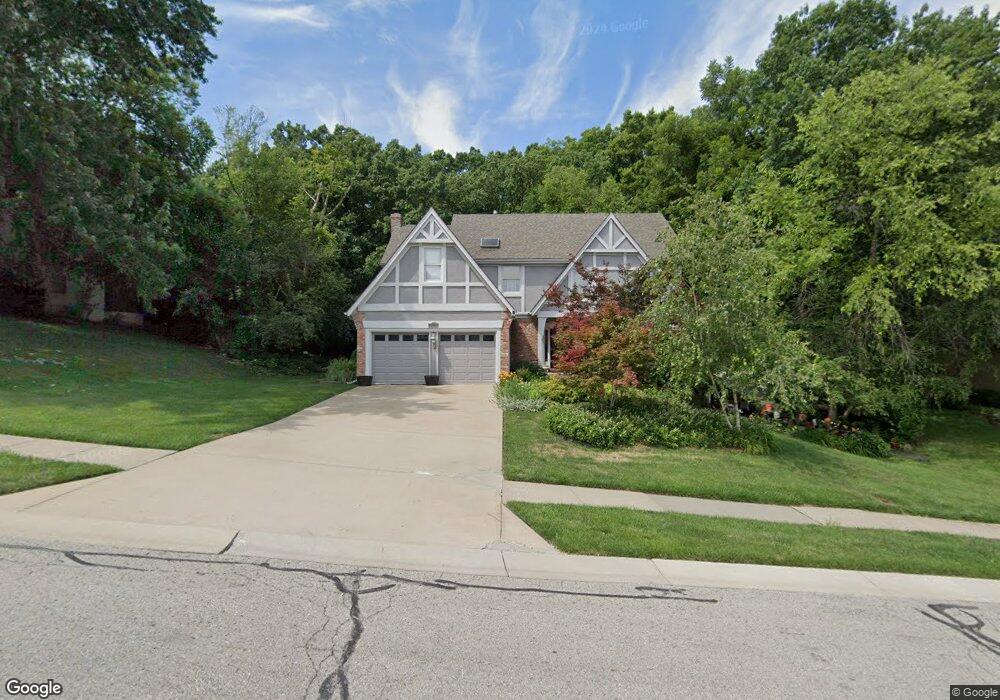
5526 Noland Rd Shawnee, KS 66216
Estimated Value: $430,937 - $465,000
4
Beds
3
Baths
2,481
Sq Ft
$179/Sq Ft
Est. Value
About This Home
This home is located at 5526 Noland Rd, Shawnee, KS 66216 and is currently estimated at $443,984, approximately $178 per square foot. 5526 Noland Rd is a home located in Johnson County with nearby schools including Ray Marsh Elementary School, Trailridge Middle School, and Shawnee Mission Northwest High School.
Create a Home Valuation Report for This Property
The Home Valuation Report is an in-depth analysis detailing your home's value as well as a comparison with similar homes in the area
Home Values in the Area
Average Home Value in this Area
Tax History Compared to Growth
Tax History
| Year | Tax Paid | Tax Assessment Tax Assessment Total Assessment is a certain percentage of the fair market value that is determined by local assessors to be the total taxable value of land and additions on the property. | Land | Improvement |
|---|---|---|---|---|
| 2024 | $4,568 | $43,090 | $8,190 | $34,900 |
| 2023 | $4,525 | $42,182 | $8,190 | $33,992 |
| 2022 | $4,220 | $39,203 | $8,190 | $31,013 |
| 2021 | $3,989 | $34,811 | $7,443 | $27,368 |
| 2020 | $3,869 | $33,316 | $6,767 | $26,549 |
| 2019 | $3,768 | $32,430 | $6,193 | $26,237 |
| 2018 | $3,716 | $31,855 | $6,193 | $25,662 |
| 2017 | $3,498 | $29,520 | $5,630 | $23,890 |
| 2016 | $3,554 | $29,612 | $5,630 | $23,982 |
| 2015 | $3,209 | $27,715 | $5,630 | $22,085 |
| 2013 | -- | $24,000 | $5,630 | $18,370 |
Source: Public Records
Map
Nearby Homes
- 5507 Noland Rd
- 5530 Rene St
- 13804 W 55th Terrace
- 5703 Cottonwood St
- 5807 Noland Rd
- 12809 W 57th Terrace
- 13800 W 58th Terrace
- 5919 Pflumm Rd
- 13810 W 53rd St
- 12508 W 56th St
- 12510 Johnson Dr
- 5021 Bradshaw St
- 13305 W 51st St
- 5013 Bradshaw St
- 5845 Caenen St
- 5633 Oakview St
- 6143 Park St
- 6145 Park St
- 13130 W 52nd Terrace
- 13126 W 52nd Terrace
- 5530 Noland Rd
- 5522 Noland Rd
- 13410 W 56th Terrace
- 13414 W 56th Terrace
- 13406 W 56th Terrace
- 5632 Noland Rd
- 5518 Noland Rd
- 13418 W 56th Terrace
- 5525 Noland Rd
- 5519 Noland Rd
- 13402 W 56th Terrace
- 5529 Noland Rd
- 5636 Noland Rd
- 13422 W 56th Terrace
- 5633 Noland Rd
- 13320 W 56th Terrace
- 13216 W 55th Terrace
- 13407 W 56th Terrace
- 13413 W 56th Terrace
- 5515 Noland Rd