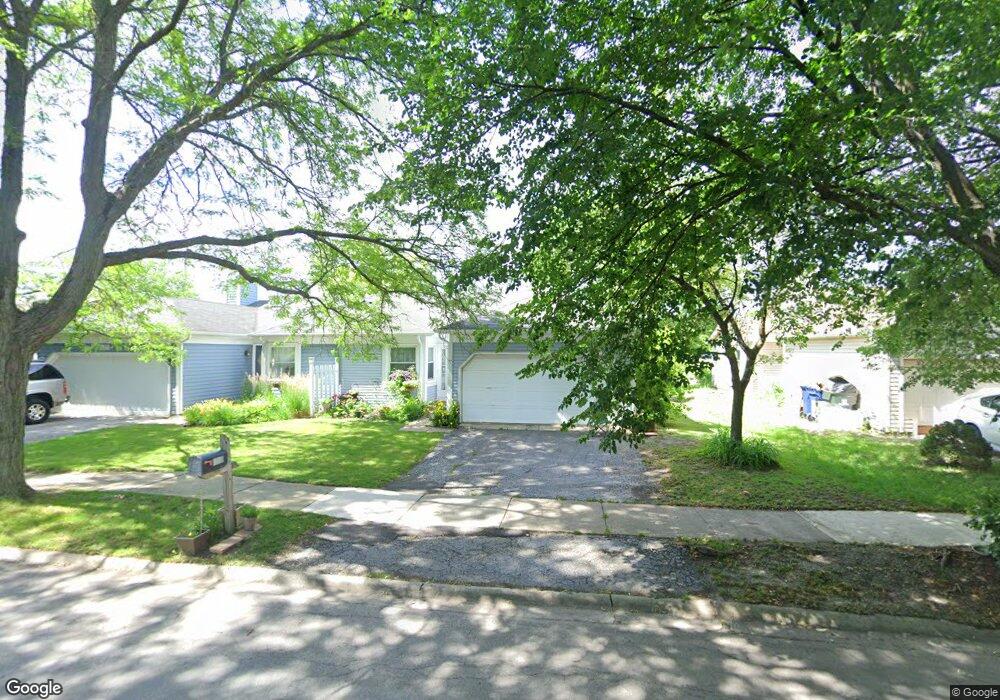
553 Fessler Ave Naperville, IL 60565
Westglen NeighborhoodEstimated Value: $330,513 - $357,000
--
Bed
2
Baths
1,339
Sq Ft
$256/Sq Ft
Est. Value
About This Home
This home is located at 553 Fessler Ave, Naperville, IL 60565 and is currently estimated at $342,128, approximately $255 per square foot. 553 Fessler Ave is a home located in DuPage County with nearby schools including Owen Elementary School, Mill Street Elementary School, and Waubonsie Valley High School.
Ownership History
Date
Name
Owned For
Owner Type
Purchase Details
Closed on
Aug 1, 2003
Sold by
Mallard Lerond and Daly Mallard Ann
Bought by
Wong Annie Chee Jui
Current Estimated Value
Home Financials for this Owner
Home Financials are based on the most recent Mortgage that was taken out on this home.
Original Mortgage
$110,000
Interest Rate
4.12%
Mortgage Type
Purchase Money Mortgage
Purchase Details
Closed on
Dec 15, 2000
Sold by
Sieber Wendy A
Bought by
Mallard Lerond and Daly Mallard Ann
Home Financials for this Owner
Home Financials are based on the most recent Mortgage that was taken out on this home.
Original Mortgage
$142,447
Interest Rate
7.77%
Mortgage Type
FHA
Purchase Details
Closed on
Nov 22, 1994
Sold by
Fredericks Sigmund L and Fredericks Sigmund Casey
Bought by
Sieber Wendy A
Home Financials for this Owner
Home Financials are based on the most recent Mortgage that was taken out on this home.
Original Mortgage
$89,600
Interest Rate
8.25%
Create a Home Valuation Report for This Property
The Home Valuation Report is an in-depth analysis detailing your home's value as well as a comparison with similar homes in the area
Home Values in the Area
Average Home Value in this Area
Purchase History
| Date | Buyer | Sale Price | Title Company |
|---|---|---|---|
| Wong Annie Chee Jui | $165,500 | Burnet Title Llc | |
| Mallard Lerond | $143,500 | -- | |
| Sieber Wendy A | $112,000 | -- |
Source: Public Records
Mortgage History
| Date | Status | Borrower | Loan Amount |
|---|---|---|---|
| Previous Owner | Wong Annie Chee Jui | $110,000 | |
| Previous Owner | Mallard Lerond | $142,447 | |
| Previous Owner | Sieber Wendy A | $89,600 |
Source: Public Records
Tax History Compared to Growth
Tax History
| Year | Tax Paid | Tax Assessment Tax Assessment Total Assessment is a certain percentage of the fair market value that is determined by local assessors to be the total taxable value of land and additions on the property. | Land | Improvement |
|---|---|---|---|---|
| 2024 | $5,697 | $91,269 | $25,997 | $65,272 |
| 2023 | $5,483 | $82,010 | $23,360 | $58,650 |
| 2022 | $4,990 | $73,020 | $20,640 | $52,380 |
| 2021 | $4,840 | $70,410 | $19,900 | $50,510 |
| 2020 | $4,833 | $70,410 | $19,900 | $50,510 |
| 2019 | $4,653 | $66,970 | $18,930 | $48,040 |
| 2018 | $4,478 | $63,260 | $17,740 | $45,520 |
| 2017 | $4,362 | $61,120 | $17,140 | $43,980 |
| 2016 | $4,291 | $58,660 | $16,450 | $42,210 |
| 2015 | $4,262 | $55,700 | $15,620 | $40,080 |
| 2014 | $3,824 | $48,240 | $13,430 | $34,810 |
| 2013 | $3,814 | $48,570 | $13,520 | $35,050 |
Source: Public Records
Map
Nearby Homes
- 1033 Emerald Dr
- 1259 Natchez Trace Cir
- 856 Cardiff Rd
- 344 Waxwing Ave
- 316 Hemlock Ln
- 425 W Gartner Rd
- 225 Elmwood Dr
- 1114 Tennyson Ln
- 1208 Tennyson Ln
- 845 Tulip Ln
- 1443 Meander Dr
- 132 Robin Hill Dr
- 1259 Tennyson Ln Unit 1707
- 165 Tamarack Ave
- 213 Winding Creek Dr
- 7S410 Arbor Dr
- 303 Cedarbrook Rd
- 31 Golden Larch Ct
- 821 Wellner Rd
- 325 Pine Ct
- 555 Fessler Ave
- 551 Fessler Ave
- 549 Fessler Ave
- 557 Fessler Ave
- 547 Fessler Ave Unit 1
- 547 Fessler Ave
- 559 Fessler Ave
- 550 Fessler Ave
- 548 Fessler Ave
- 552 Fessler Ave Unit 5
- 545 Fessler Ave
- 546 Fessler Ave
- 1373 Rennet Dr
- 554 Fessler Ave
- 544 Fessler Ave
- 543 Fessler Ave
- 556 Fessler Ave
- 542 Fessler Ave
- 1375 Rennet Dr
- 541 Fessler Ave