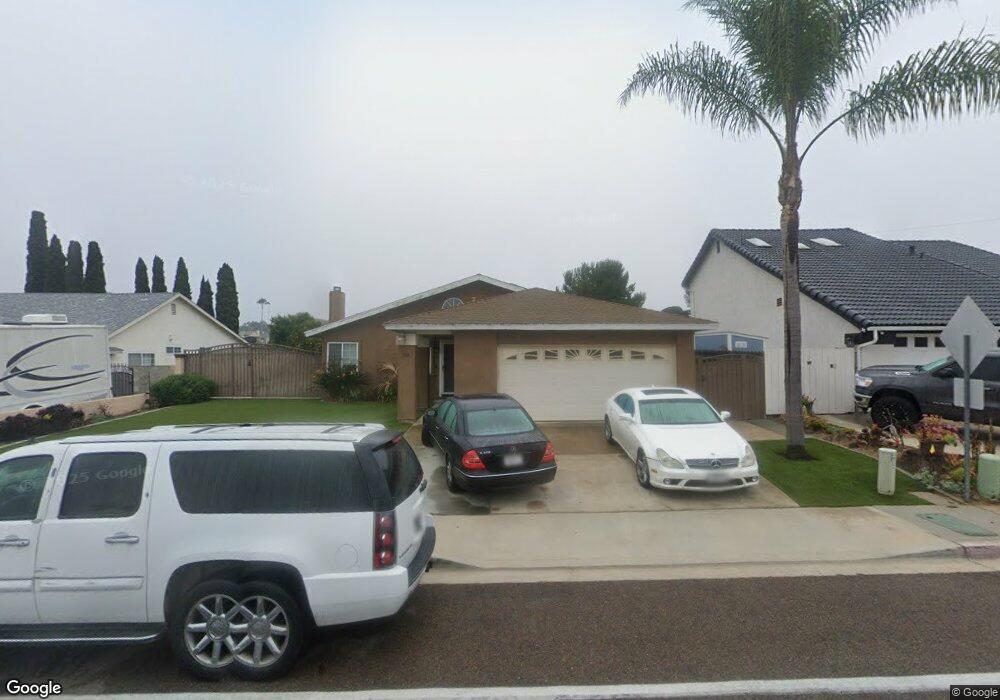
554 E J St Chula Vista, CA 91910
Rancho Del Rey NeighborhoodEstimated Value: $811,440 - $869,000
4
Beds
2
Baths
1,560
Sq Ft
$544/Sq Ft
Est. Value
About This Home
This home is located at 554 E J St, Chula Vista, CA 91910 and is currently estimated at $848,110, approximately $543 per square foot. 554 E J St is a home located in San Diego County with nearby schools including Halecrest Elementary School, Hilltop Middle School, and Hilltop Senior High School.
Ownership History
Date
Name
Owned For
Owner Type
Purchase Details
Closed on
Oct 24, 2000
Sold by
Oscar Figueroa
Bought by
Corona Clemente A and Corona Irene
Current Estimated Value
Home Financials for this Owner
Home Financials are based on the most recent Mortgage that was taken out on this home.
Original Mortgage
$192,800
Outstanding Balance
$69,809
Interest Rate
7.82%
Estimated Equity
$778,301
Purchase Details
Closed on
Dec 24, 1997
Sold by
Oscar Figueroa
Bought by
Figueroa Oscar
Home Financials for this Owner
Home Financials are based on the most recent Mortgage that was taken out on this home.
Original Mortgage
$153,000
Interest Rate
9.37%
Purchase Details
Closed on
Oct 22, 1997
Sold by
Margarita Figueroa
Bought by
Figueroa Oscar
Purchase Details
Closed on
Sep 2, 1983
Create a Home Valuation Report for This Property
The Home Valuation Report is an in-depth analysis detailing your home's value as well as a comparison with similar homes in the area
Home Values in the Area
Average Home Value in this Area
Purchase History
| Date | Buyer | Sale Price | Title Company |
|---|---|---|---|
| Corona Clemente A | $241,000 | Commonwealth Land Title Co | |
| Figueroa Oscar | -- | Old Republic Title Company | |
| Figueroa Oscar | -- | Orange Coast Title Companies | |
| -- | $112,000 | -- |
Source: Public Records
Mortgage History
| Date | Status | Borrower | Loan Amount |
|---|---|---|---|
| Open | Corona Clemente A | $192,800 | |
| Previous Owner | Figueroa Oscar | $153,000 | |
| Closed | Corona Clemente A | $24,100 |
Source: Public Records
Tax History
| Year | Tax Paid | Tax Assessment Tax Assessment Total Assessment is a certain percentage of the fair market value that is determined by local assessors to be the total taxable value of land and additions on the property. | Land | Improvement |
|---|---|---|---|---|
| 2025 | $4,196 | $370,369 | $100,097 | $270,272 |
| 2024 | $4,196 | $363,108 | $98,135 | $264,973 |
| 2023 | $4,138 | $355,989 | $96,211 | $259,778 |
| 2022 | $4,017 | $349,010 | $94,325 | $254,685 |
| 2021 | $3,923 | $342,168 | $92,476 | $249,692 |
| 2020 | $3,829 | $338,660 | $91,528 | $247,132 |
| 2019 | $3,729 | $332,021 | $89,734 | $242,287 |
| 2018 | $3,670 | $325,512 | $87,975 | $237,537 |
| 2017 | $3,592 | $319,130 | $86,250 | $232,880 |
| 2016 | $3,506 | $312,873 | $84,559 | $228,314 |
| 2015 | $3,456 | $308,174 | $83,289 | $224,885 |
| 2014 | $3,397 | $302,138 | $81,658 | $220,480 |
Source: Public Records
Map
Nearby Homes
- 607 E J St
- 919 Caminito Estrella
- 417 Sanibelle Cir Unit 91
- 453 Hidden Vista Dr
- 991 Calma Dr
- 939 Nolan Way
- 302 Windjammer Cir
- 1008 Calma Dr
- 902 Monterey Ct
- 350 Windjammer Cir
- 476 Montclair St
- 0 Julian Estates Rd Ct Unit NP26049137
- 586 88 Roosevelt St
- 445 Montcalm St
- 202 E J St
- 953 Maria Way
- 835 Cedarbend Way
- 655 Robert Ave
- 0 Randy Ln Unit PTP2506583
- 664 Rainbow Dr
Your Personal Tour Guide
Ask me questions while you tour the home.