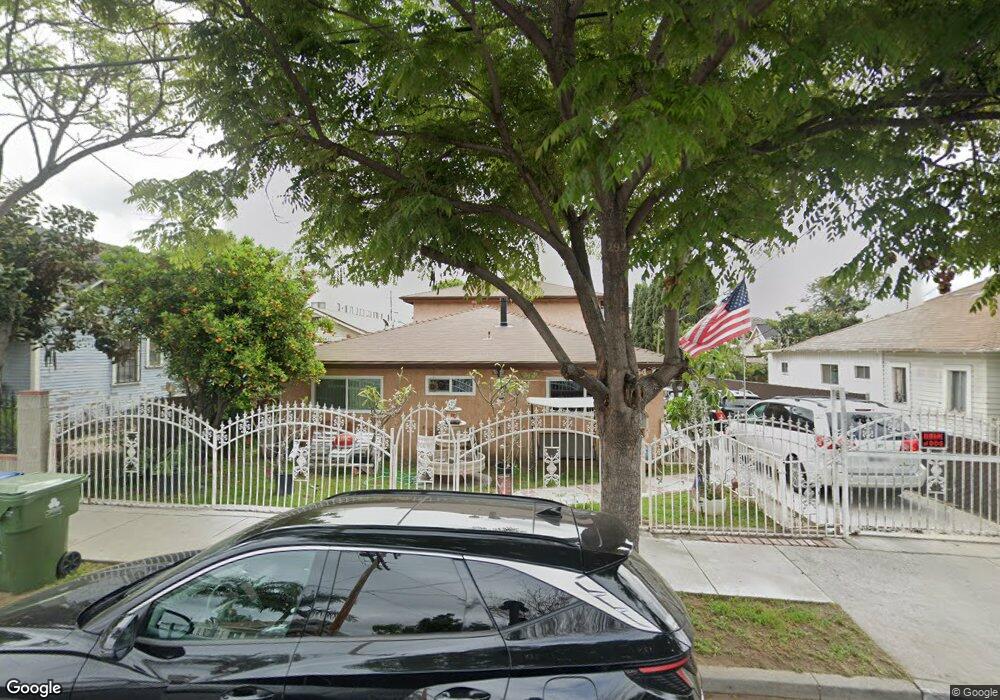
554 N St Louis St Unit A Los Angeles, CA 90033
Boyle Heights NeighborhoodEstimated Value: $797,000 - $886,000
8
Beds
4
Baths
2,664
Sq Ft
$320/Sq Ft
Est. Value
About This Home
This home is located at 554 N St Louis St Unit A, Los Angeles, CA 90033 and is currently estimated at $851,333, approximately $319 per square foot. 554 N St Louis St Unit A is a home located in Los Angeles County with nearby schools including Sheridan Street Elementary School, Hollenbeck Middle School, and Theodore Roosevelt High School.
Ownership History
Date
Name
Owned For
Owner Type
Purchase Details
Closed on
Mar 28, 2025
Sold by
Gonzales Stella C
Bought by
Gonzales Stella C and Gonzales Deanna
Current Estimated Value
Home Financials for this Owner
Home Financials are based on the most recent Mortgage that was taken out on this home.
Original Mortgage
$491,500
Outstanding Balance
$489,401
Interest Rate
6.85%
Mortgage Type
New Conventional
Estimated Equity
$361,932
Purchase Details
Closed on
Jul 26, 2019
Sold by
Orozco Alberto and Gonzales Deanna Leonis
Bought by
Gonzales Manuel R and Gonzales Stella C
Purchase Details
Closed on
Mar 16, 2016
Sold by
Gonzales Manuel E
Bought by
Orozco Alberto and Gonzales Deanna Leonis
Home Financials for this Owner
Home Financials are based on the most recent Mortgage that was taken out on this home.
Original Mortgage
$318,750
Interest Rate
3.65%
Mortgage Type
New Conventional
Create a Home Valuation Report for This Property
The Home Valuation Report is an in-depth analysis detailing your home's value as well as a comparison with similar homes in the area
Home Values in the Area
Average Home Value in this Area
Purchase History
| Date | Buyer | Sale Price | Title Company |
|---|---|---|---|
| Gonzales Stella C | -- | First American Title Insurance | |
| Gonzales Manuel R | -- | None Available | |
| Orozco Alberto | -- | None Available |
Source: Public Records
Mortgage History
| Date | Status | Borrower | Loan Amount |
|---|---|---|---|
| Open | Gonzales Stella C | $491,500 | |
| Previous Owner | Orozco Alberto | $318,750 |
Source: Public Records
Tax History Compared to Growth
Tax History
| Year | Tax Paid | Tax Assessment Tax Assessment Total Assessment is a certain percentage of the fair market value that is determined by local assessors to be the total taxable value of land and additions on the property. | Land | Improvement |
|---|---|---|---|---|
| 2025 | $1,534 | $98,487 | $26,933 | $71,554 |
| 2024 | $1,534 | $96,556 | $26,405 | $70,151 |
| 2023 | $1,511 | $94,664 | $25,888 | $68,776 |
| 2022 | $1,452 | $92,809 | $25,381 | $67,428 |
| 2021 | $1,419 | $90,990 | $24,884 | $66,106 |
| 2020 | $1,425 | $90,058 | $24,629 | $65,429 |
| 2019 | $1,383 | $88,294 | $24,147 | $64,147 |
| 2018 | $1,295 | $86,564 | $23,674 | $62,890 |
| 2016 | $1,208 | $83,204 | $22,755 | $60,449 |
| 2015 | $1,193 | $81,955 | $22,414 | $59,541 |
| 2014 | $1,217 | $80,350 | $21,975 | $58,375 |
Source: Public Records
Map
Nearby Homes
- 574 N St Louis St
- 1031 1033 N Fickett
- 357 Cornwell St
- 617 N Cummings St
- 425 Cornwell St
- 524 N Cummings St
- 500 N St Louis St
- 2107 E Cesar e Chavez Ave
- 244 N Chicago St
- 622 Cornwell St
- 702 Cornwell St
- 223 N Breed St
- 2415 Boulder St
- 727 Cornwell St
- 2221 Michigan Ave
- 736 N Breed St
- 2437 Malabar St
- 638 N Boyle Ave
- 701 N Fickett St
- 2437 Houston St
- 550 N St Louis St
- 562 N St Louis St
- 550 N Saint Louis St
- 546 N St Louis St
- 566 N St Louis St
- 355 N Chicago St
- 359 N Chicago St
- 349 N Chicago St
- 363 N Chicago St
- 540 N St Louis St
- 347 N Chicago St
- 367 N Chicago St
- 557 N St Louis St
- 561 N St Louis St
- 553 N St Louis St
- 341 N Chicago St
- 576 N St Louis St
- 536 N St Louis St
- 565 N St Louis St
- 547 N St Louis St