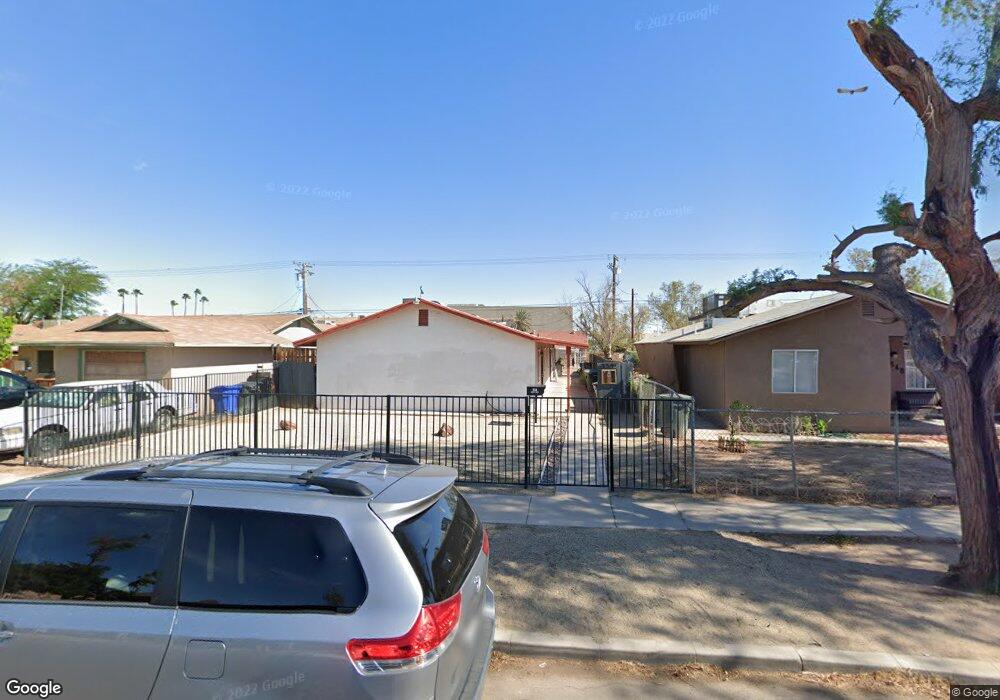
554 W Holt Ave Unit 554 1/2 El Centro, CA 92243
Estimated Value: $371,000 - $552,000
--
Bed
--
Bath
2,210
Sq Ft
$200/Sq Ft
Est. Value
About This Home
This home is located at 554 W Holt Ave Unit 554 1/2, El Centro, CA 92243 and is currently estimated at $442,512, approximately $200 per square foot. 554 W Holt Ave Unit 554 1/2 is a home located in Imperial County with nearby schools including Harding Elementary School, Wilson Jr. High, and Central Union High School.
Ownership History
Date
Name
Owned For
Owner Type
Purchase Details
Closed on
Jun 1, 2022
Sold by
Neild Raymond J
Bought by
Rjn Living Trust and Neild
Current Estimated Value
Purchase Details
Closed on
Mar 14, 2014
Sold by
Neild Raymond J and Neild J R
Bought by
Neild Raymond J
Home Financials for this Owner
Home Financials are based on the most recent Mortgage that was taken out on this home.
Original Mortgage
$117,750
Interest Rate
4.25%
Mortgage Type
Commercial
Purchase Details
Closed on
Mar 29, 2013
Sold by
Grissom Velma M
Bought by
Neild R J
Purchase Details
Closed on
Aug 25, 1998
Sold by
Tieuel Eddie Jean
Bought by
Grissom Columbus and Grissom Velma M
Purchase Details
Closed on
Sep 22, 1997
Sold by
Grissom Columbus M and Grissom Velma M
Bought by
Tieuel Eddie Jean
Create a Home Valuation Report for This Property
The Home Valuation Report is an in-depth analysis detailing your home's value as well as a comparison with similar homes in the area
Home Values in the Area
Average Home Value in this Area
Purchase History
| Date | Buyer | Sale Price | Title Company |
|---|---|---|---|
| Rjn Living Trust | -- | Downer Stephanie S | |
| Neild Raymond J | -- | Stewart Title Of Ca Inc | |
| Neild R J | $130,000 | Chicago Title Company | |
| Grissom Columbus | -- | -- | |
| Tieuel Eddie Jean | -- | -- |
Source: Public Records
Mortgage History
| Date | Status | Borrower | Loan Amount |
|---|---|---|---|
| Previous Owner | Neild Raymond J | $117,750 |
Source: Public Records
Tax History Compared to Growth
Tax History
| Year | Tax Paid | Tax Assessment Tax Assessment Total Assessment is a certain percentage of the fair market value that is determined by local assessors to be the total taxable value of land and additions on the property. | Land | Improvement |
|---|---|---|---|---|
| 2025 | $1,821 | $160,072 | $30,779 | $129,293 |
| 2023 | $1,821 | $153,858 | $29,585 | $124,273 |
| 2022 | $1,740 | $150,842 | $29,005 | $121,837 |
| 2021 | $1,697 | $147,886 | $28,437 | $119,449 |
| 2020 | $1,729 | $146,371 | $28,146 | $118,225 |
| 2019 | $1,678 | $143,502 | $27,595 | $115,907 |
| 2018 | $1,669 | $140,689 | $27,054 | $113,635 |
| 2017 | $1,652 | $137,931 | $26,524 | $111,407 |
| 2016 | $1,620 | $135,227 | $26,004 | $109,223 |
| 2015 | -- | $133,197 | $25,614 | $107,583 |
| 2014 | -- | $130,589 | $25,113 | $105,476 |
Source: Public Records
Map
Nearby Homes
- 655 W Brighton Ave Unit 653
- 470 W Olive Ave
- 464 W Olive Ave Unit 464
- 337 W Hamilton Ave
- 1115 S 6th St
- 730 S 8th St
- 556 Sandalwood Dr
- 620 Sandalwood Dr
- 492 Sandalwood Dr
- 543 Sandalwood Dr
- 407 Sandalwood Dr
- 1112 S 8th St
- 755 Sandalwood Dr
- 1118 S 8th St Unit LU30
- 1066 S 8th St
- 552 Yucca Dr
- 734 Broadway Ave
- 1066 W Heil Ave
- 2215 S 4th St
- 1239 W Heil Ave
- 548 W Holt Ave
- 566 W Holt Ave
- 542 W Holt Ave
- 572 W Holt Ave
- 534 W Holt Ave
- 557 W Holt Ave
- 553 W Orange Ave Unit 553 1/2
- 547 1/2 W Orange Ave
- 573 W Orange Ave
- 571 W Orange Ave
- 533 W Orange Ave
- 555 W Holt Ave Unit 557
- 567 W Holt Ave
- 543 W Holt Ave
- 537 W Orange Ave
- 535 W Holt Ave
- 523 W Holt Ave
- 528 S 5th St
- 538 W Orange Ave
- 556 W Heil Ave