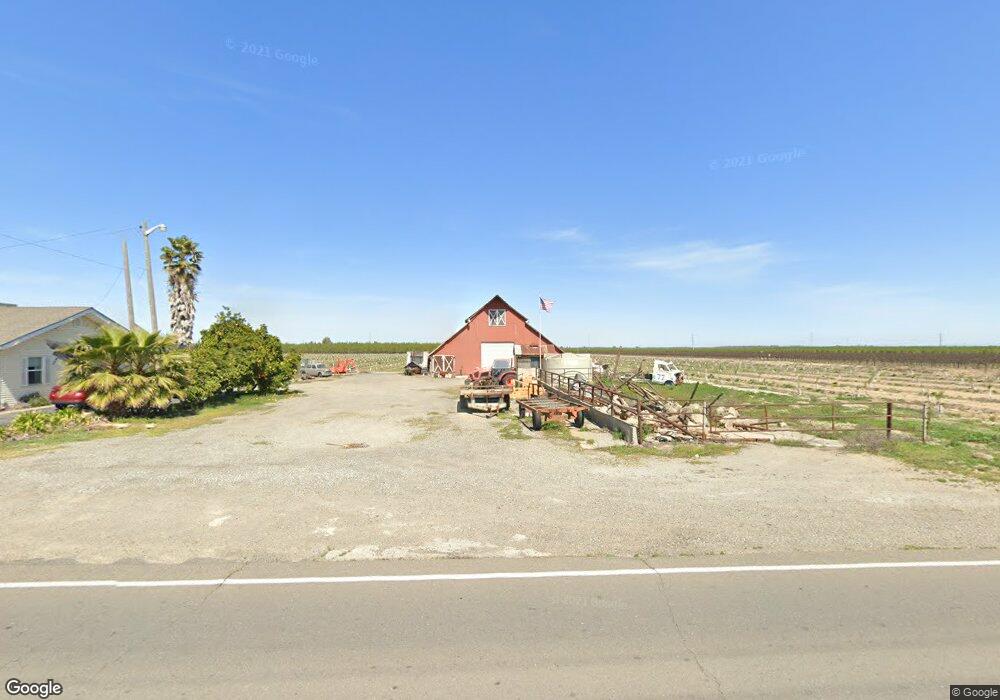
5549 Paradise Rd Modesto, CA 95358
Estimated Value: $232,000 - $1,465,000
3
Beds
1
Bath
1,253
Sq Ft
$671/Sq Ft
Est. Value
About This Home
This home is located at 5549 Paradise Rd, Modesto, CA 95358 and is currently estimated at $841,152, approximately $671 per square foot. 5549 Paradise Rd is a home located in Stanislaus County with nearby schools including Shiloh Elementary School, Modesto High School, and Shiloh Charter School.
Ownership History
Date
Name
Owned For
Owner Type
Purchase Details
Closed on
Oct 3, 2017
Sold by
Van Oostende Sonke Llc
Bought by
Van Oostende Sonke Llc
Current Estimated Value
Home Financials for this Owner
Home Financials are based on the most recent Mortgage that was taken out on this home.
Original Mortgage
$90,000
Outstanding Balance
$74,994
Interest Rate
3.82%
Mortgage Type
New Conventional
Estimated Equity
$766,158
Purchase Details
Closed on
Mar 20, 2015
Sold by
Sonke Dennis and Sonke Johanne
Bought by
Van Oostende Sonke Llc
Purchase Details
Closed on
Feb 6, 2015
Sold by
Vanoostende Anton H
Bought by
Sonke Dennis and Sonke Johanne
Purchase Details
Closed on
Aug 8, 2011
Sold by
Vanoostende Anton H
Bought by
Vanoostende Anton H
Purchase Details
Closed on
Apr 18, 2007
Sold by
Dewitte Jan and De Witte Bernice
Bought by
Vanoostende Anton H and Vanoostende Van Oostende
Create a Home Valuation Report for This Property
The Home Valuation Report is an in-depth analysis detailing your home's value as well as a comparison with similar homes in the area
Home Values in the Area
Average Home Value in this Area
Purchase History
| Date | Buyer | Sale Price | Title Company |
|---|---|---|---|
| Van Oostende Sonke Llc | -- | Chicago Title Company | |
| Van Oostende Sonke Llc | -- | None Available | |
| Sonke Dennis | $739,000 | Chicago Title Company | |
| Vanoostende Anton H | -- | None Available | |
| Vanoostende Anton H | -- | Alliance Title Company | |
| Vanoostende Anton H | -- | Alliance Title Company |
Source: Public Records
Mortgage History
| Date | Status | Borrower | Loan Amount |
|---|---|---|---|
| Open | Van Oostende Sonke Llc | $90,000 | |
| Closed | Sonke Dennis | $0 |
Source: Public Records
Tax History Compared to Growth
Tax History
| Year | Tax Paid | Tax Assessment Tax Assessment Total Assessment is a certain percentage of the fair market value that is determined by local assessors to be the total taxable value of land and additions on the property. | Land | Improvement |
|---|---|---|---|---|
| 2025 | $2,387 | $209,206 | $130,186 | $79,020 |
| 2024 | $2,344 | $205,105 | $127,634 | $77,471 |
| 2023 | $2,301 | $201,084 | $125,132 | $75,952 |
| 2022 | $2,208 | $197,142 | $122,679 | $74,463 |
| 2021 | $1,735 | $152,362 | $120,274 | $32,088 |
| 2020 | $1,712 | $150,800 | $119,041 | $31,759 |
| 2019 | $1,681 | $147,844 | $116,707 | $31,137 |
| 2018 | $1,657 | $144,946 | $114,419 | $30,527 |
| 2017 | $1,621 | $142,105 | $112,176 | $29,929 |
| 2016 | $1,588 | $139,320 | $109,977 | $29,343 |
| 2015 | $1,493 | $137,229 | $108,326 | $28,903 |
| 2014 | $1,361 | $135,292 | $106,205 | $29,087 |
Source: Public Records
Map
Nearby Homes
- 0 Hart Rd Unit 225010902
- 1124 Pauline Ave
- 1721 Grimes Ave
- 2617 W Hatch Rd
- 1415 Avondale Ave
- 6613 Woodland Ave
- 3749 Shiloh Rd
- 1608 Ohio Ave
- 2370 Ridge Rd
- 0 Blue Gum Ave Unit 225133354
- 1824 California Ave
- 1512 Swalls Ln
- 3000 Woodland Ave
- 1200 S Carpenter Rd #121 Rd Unit 121
- 1200 S Carpenter Rd Unit 42
- 1200 S Carpenter Rd Unit 51
- 1200 S Carpenter Rd Unit 71
- 1200 S Carpenter Rd Unit 4
- 1200 S Carpenter Rd Unit 105
- 1105 Memory Ln
- 5500 Paradise Rd
- 5461 Paradise Rd
- 5448 Paradise Rd
- 5806 Paradise Rd
- 5807 Paradise Rd
- 1872 Broyles Rd
- 1831 Broyles Rd
- 2437 Baker Rd
- 5919 Paradise Rd
- 1801 Broyles Rd
- 6012 Paradise Rd
- 1718 Broyles Rd
- 2131 Stone Ave
- 1861 Stone Ave
- 6100 Paradise Rd
- 0 Paradise Rd Unit 14072432
- 0 Paradise Rd Unit 16065882
- 0 Paradise Rd Unit 16043829
- 0 Paradise Rd Unit 16042935
- 0 Paradise Rd Unit 16057985