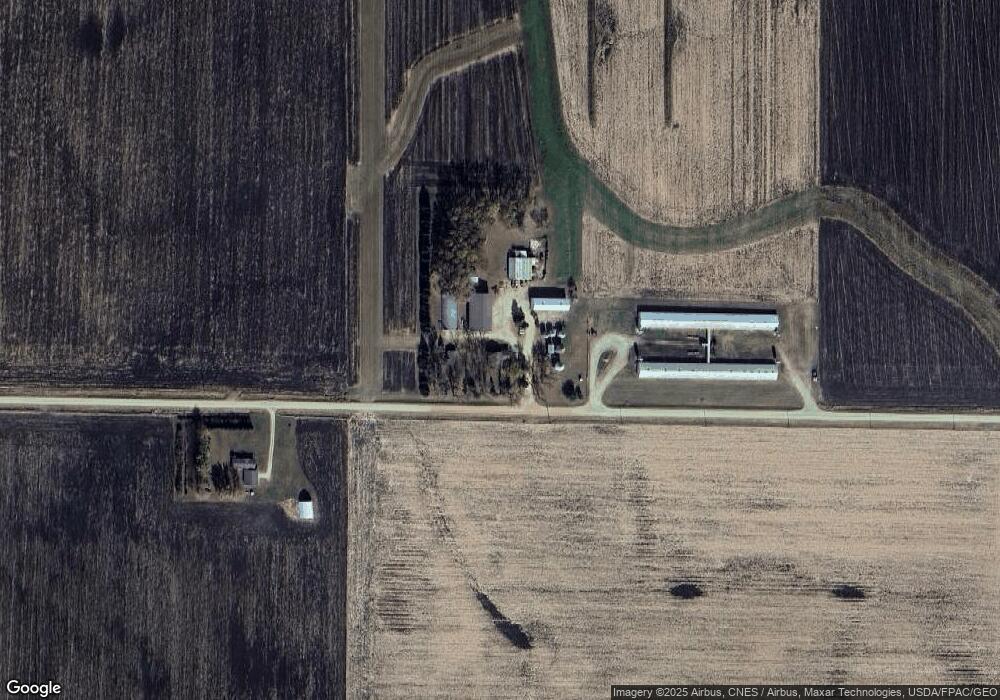
55552 113th St Mapleton, MN 56065
Estimated Value: $253,000 - $552,975
4
Beds
2
Baths
1,380
Sq Ft
$289/Sq Ft
Est. Value
About This Home
This home is located at 55552 113th St, Mapleton, MN 56065 and is currently estimated at $399,244, approximately $289 per square foot. 55552 113th St is a home located in Blue Earth County with nearby schools including Maple River Secondary School.
Ownership History
Date
Name
Owned For
Owner Type
Purchase Details
Closed on
Jul 25, 2011
Sold by
Covey John R
Bought by
Covey John Scott and Covey Lanie M
Current Estimated Value
Create a Home Valuation Report for This Property
The Home Valuation Report is an in-depth analysis detailing your home's value as well as a comparison with similar homes in the area
Purchase History
| Date | Buyer | Sale Price | Title Company |
|---|---|---|---|
| Covey John Scott | $250,000 | -- |
Source: Public Records
Tax History
| Year | Tax Paid | Tax Assessment Tax Assessment Total Assessment is a certain percentage of the fair market value that is determined by local assessors to be the total taxable value of land and additions on the property. | Land | Improvement |
|---|---|---|---|---|
| 2025 | $4,114 | $539,200 | $77,700 | $461,500 |
| 2024 | $4,114 | $487,300 | $78,200 | $409,100 |
| 2023 | $4,332 | $526,400 | $77,800 | $448,600 |
| 2022 | $2,306 | $461,600 | $77,100 | $384,500 |
| 2021 | $2,248 | $367,200 | $76,700 | $290,500 |
| 2020 | $1,448 | $280,500 | $64,500 | $216,000 |
| 2019 | $1,338 | $280,500 | $64,500 | $216,000 |
| 2018 | $1,168 | $256,800 | $58,100 | $198,700 |
| 2017 | $1,188 | $240,700 | $58,100 | $182,600 |
| 2016 | $1,100 | $235,800 | $58,100 | $177,700 |
| 2015 | $10 | $224,500 | $58,100 | $166,400 |
| 2014 | $1,238 | $154,000 | $50,000 | $104,000 |
Source: Public Records
Map
Nearby Homes
- 55997 132nd St
- 340 2nd Ave S
- 103 Calm Ct SW
- 510 4th Ave SE
- 204 Central Ave N
- 411 4th Ave SE
- 206 3rd Ave SE
- 205 3rd Ave SE
- 505 Grove St SE
- 606 Smith St NE
- 15135 550th Ave Unit 15135 550th Ave
- 16225 563rd Ave
- 217 S Houk St
- 0 430th Ave
- 16280 552nd Ave
- 235 Cleveland Ave E
- 240 Cleveland Ave W
- 203 2nd St SW
- 142 3rd Ave SW
- 231 SW 3rd Ave
Your Personal Tour Guide
Ask me questions while you tour the home.