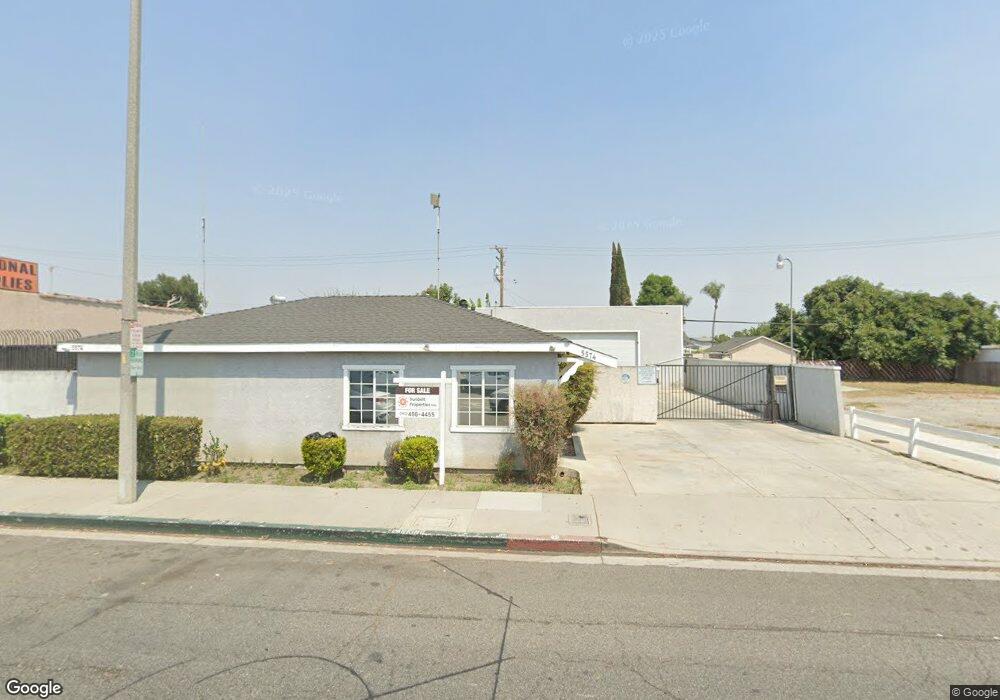
5574 Atlantic Ave Long Beach, CA 90805
Lindbergh NeighborhoodEstimated Value: $949,976
--
Bed
--
Bath
3,835
Sq Ft
$248/Sq Ft
Est. Value
About This Home
This home is located at 5574 Atlantic Ave, Long Beach, CA 90805 and is currently priced at $949,976, approximately $247 per square foot. 5574 Atlantic Ave is a home located in Los Angeles County with nearby schools including Bret Harte Elementary School, Lindbergh STEM Academy, and Jordan High School.
Ownership History
Date
Name
Owned For
Owner Type
Purchase Details
Closed on
Jun 16, 2023
Sold by
Earl Ronald Comstock Living Trust
Bought by
Earl Ronald Comstock Living Trust and Comstock
Current Estimated Value
Purchase Details
Closed on
Apr 10, 2016
Sold by
Comstock Earl R
Bought by
Comstock Earl Ronald and Earl Ronald Comstock Living Tr
Purchase Details
Closed on
Sep 18, 2012
Sold by
Milburn Michael D and Milburn Carolyn J
Bought by
Comstock Earl R
Home Financials for this Owner
Home Financials are based on the most recent Mortgage that was taken out on this home.
Original Mortgage
$281,200
Interest Rate
3.35%
Mortgage Type
Commercial
Purchase Details
Closed on
Apr 26, 2007
Sold by
Milburn Michael D and Milburn Carolyn J
Bought by
Milburn Michael D and Milburn Carolyn J
Create a Home Valuation Report for This Property
The Home Valuation Report is an in-depth analysis detailing your home's value as well as a comparison with similar homes in the area
Home Values in the Area
Average Home Value in this Area
Purchase History
| Date | Buyer | Sale Price | Title Company |
|---|---|---|---|
| Earl Ronald Comstock Living Trust | -- | None Listed On Document | |
| Comstock Earl Ronald | -- | None Available | |
| Comstock Earl R | $375,000 | North American Title Company | |
| Milburn Michael D | -- | North American Title Company | |
| Milburn Michael D | -- | None Available |
Source: Public Records
Mortgage History
| Date | Status | Borrower | Loan Amount |
|---|---|---|---|
| Previous Owner | Milburn Michael D | $281,200 |
Source: Public Records
Tax History Compared to Growth
Tax History
| Year | Tax Paid | Tax Assessment Tax Assessment Total Assessment is a certain percentage of the fair market value that is determined by local assessors to be the total taxable value of land and additions on the property. | Land | Improvement |
|---|---|---|---|---|
| 2025 | $7,365 | $461,774 | $332,481 | $129,293 |
| 2024 | $7,365 | $452,720 | $325,962 | $126,758 |
| 2023 | $7,226 | $443,844 | $319,571 | $124,273 |
| 2022 | $6,728 | $435,142 | $313,305 | $121,837 |
| 2021 | $8,144 | $426,611 | $307,162 | $119,449 |
| 2019 | $6,485 | $413,959 | $298,052 | $115,907 |
| 2018 | $6,177 | $405,843 | $292,208 | $113,635 |
| 2016 | $5,722 | $390,085 | $280,862 | $109,223 |
| 2015 | $5,530 | $384,227 | $276,644 | $107,583 |
| 2014 | $5,504 | $376,701 | $271,225 | $105,476 |
Source: Public Records
Map
Nearby Homes
- 473 E 55th St
- 5808 Linden Ave Unit 3
- 800 E South St
- 5824 Linden Ave Unit 1
- 5709 California Ave
- Plan 2165 at Rhythm
- Plan 1630 Modeled at Rhythm
- Plan 1403 Modeled at Rhythm
- Plan 1881 at Rhythm
- Plan 1860 at Rhythm
- 5636 California Ave
- 401 E 55th St
- 5868 Linden Ave Unit 6
- 5868 Linden Ave Unit 3
- 5467 California Ave
- 5876 Linden Ave Unit 7
- 402 E Louise St
- 721 E 59th St
- 5557 Lemon Ave
- 309 E Louise St
- 5577 Lime Ave
- 5575 Lime Ave
- 5588 Atlantic Ave
- 5585 Lime Ave
- 5563 Lime Ave
- 5587 Lime Ave
- 5557 Lime Ave
- 5550 Atlantic Ave
- 5596 Atlantic Ave
- 5597 Lime Ave
- 5551 Lime Ave
- 5540 Atlantic Ave
- 5545 Lime Ave
- 5565 Atlantic Ave
- 5536 Atlantic Ave
- 5557 Atlantic Ave
- 5537 Lime Ave
- 5601 Lime Ave
- 5551 Atlantic Ave
- 5574 Lime Ave