56 Case St Mount Morris, NY 14510
Estimated Value: $127,000 - $160,000
3
Beds
2
Baths
1,116
Sq Ft
$127/Sq Ft
Est. Value
About This Home
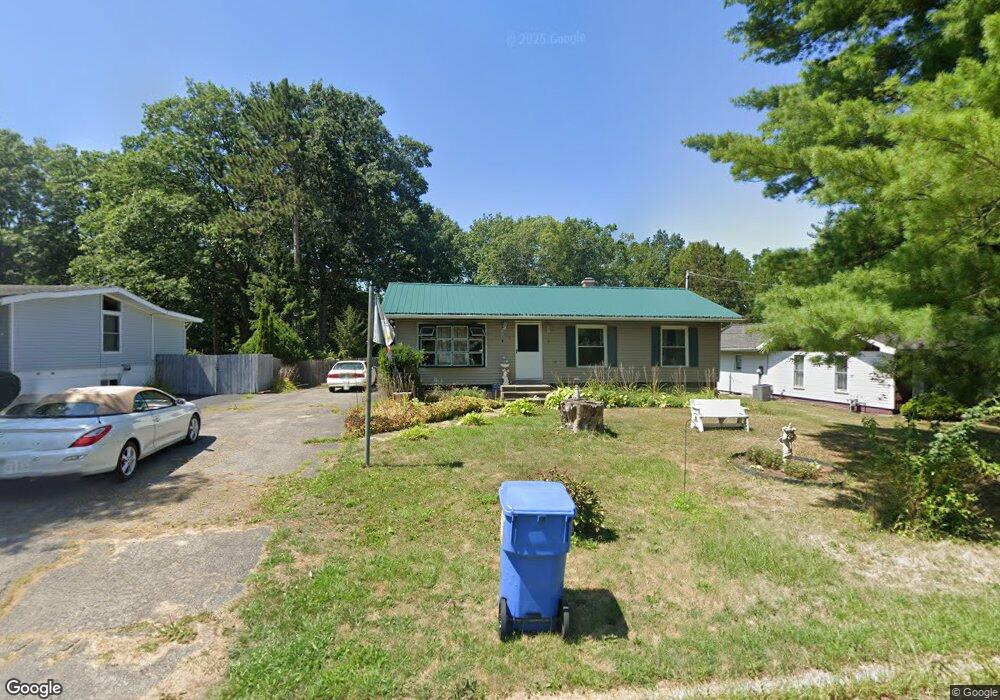
This home is located at 56 Case St, Mount Morris, NY 14510 and is currently estimated at $141,897, approximately $127 per square foot. 56 Case St is a home located in Livingston County with nearby schools including Mount Morris Elementary School and Mount Morris Junior/Senior High School.
Ownership History
Date
Name
Owned For
Owner Type
Purchase Details
Closed on
Oct 13, 2006
Sold by
Kemp John
Bought by
Vakelli Randall J
Current Estimated Value
Home Financials for this Owner
Home Financials are based on the most recent Mortgage that was taken out on this home.
Original Mortgage
$58,500
Outstanding Balance
$34,927
Interest Rate
6.47%
Mortgage Type
Purchase Money Mortgage
Estimated Equity
$106,970
Purchase Details
Closed on
Feb 6, 2006
Purchase Details
Closed on
Sep 7, 2005
Create a Home Valuation Report for This Property
The Home Valuation Report is an in-depth analysis detailing your home's value as well as a comparison with similar homes in the area
Home Values in the Area
Average Home Value in this Area
Purchase History
| Date | Buyer | Sale Price | Title Company |
|---|---|---|---|
| Vakelli Randall J | $65,000 | -- | |
| -- | $45,000 | -- | |
| -- | $63,367 | -- |
Source: Public Records
Mortgage History
| Date | Status | Borrower | Loan Amount |
|---|---|---|---|
| Open | Vakelli Randall J | $58,500 |
Source: Public Records
Tax History
| Year | Tax Paid | Tax Assessment Tax Assessment Total Assessment is a certain percentage of the fair market value that is determined by local assessors to be the total taxable value of land and additions on the property. | Land | Improvement |
|---|---|---|---|---|
| 2024 | $3,833 | $85,500 | $16,400 | $69,100 |
| 2023 | $2,181 | $85,500 | $16,400 | $69,100 |
| 2022 | $4,029 | $85,500 | $16,400 | $69,100 |
| 2021 | $4,236 | $77,900 | $13,400 | $64,500 |
| 2020 | $2,472 | $77,900 | $13,400 | $64,500 |
| 2019 | $2,437 | $77,900 | $13,400 | $64,500 |
| 2018 | $2,437 | $77,900 | $13,400 | $64,500 |
| 2017 | $2,441 | $75,400 | $13,400 | $62,000 |
| 2016 | $3,258 | $75,400 | $13,400 | $62,000 |
| 2015 | -- | $75,400 | $13,400 | $62,000 |
| 2014 | -- | $75,400 | $13,400 | $62,000 |
Source: Public Records
Map
Nearby Homes
- 202 Main St
- 12 Prospect St
- 134 Main St
- 0 Mount Morris Nunda Rd
- 43 Chapel St
- 3 Pine Cone Ln
- 5502 Mount Morris Rd
- 6100 Groveland Station Rd
- 0 Sonyea Rd
- 7214 Mount Morris Nunda Rd
- 5270 Wheelock Rd
- 2868 Jones Bridge Rd
- 10 Market St
- 7998 Dutch Street Rd
- 8045 Dutch Street Rd
- 7570 Spencer Ln
- 7565 Schenck Rd
- 4540 York Rd
- 10 Simmons Rd
- 11 Genesee St E
Your Personal Tour Guide
Ask me questions while you tour the home.