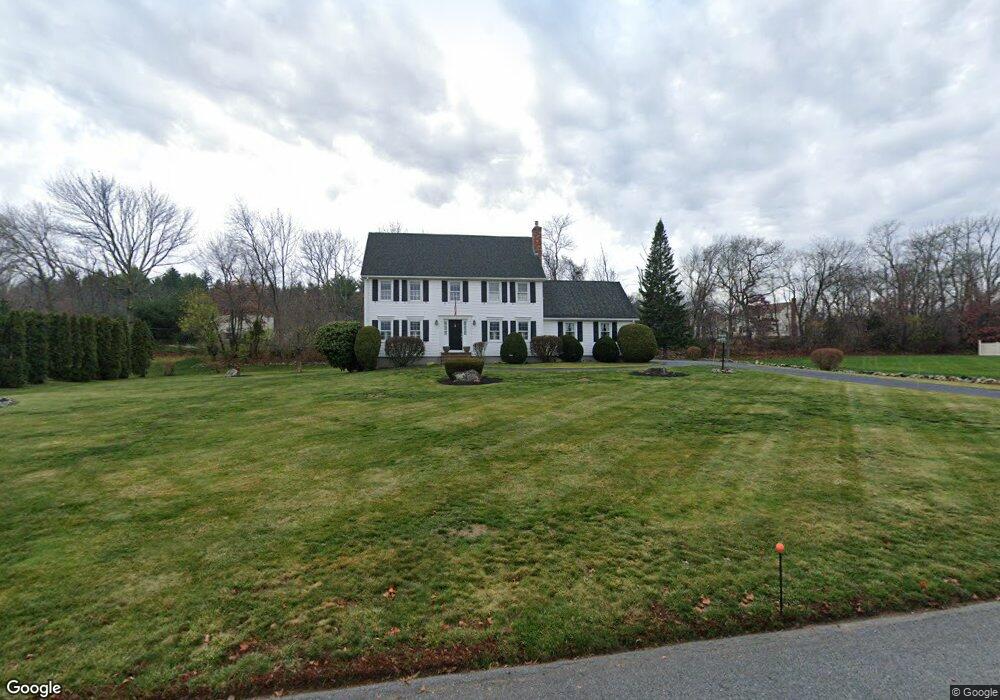
56 Wilshire Cir Dracut, MA 01826
Estimated Value: $732,979 - $852,000
3
Beds
3
Baths
2,222
Sq Ft
$350/Sq Ft
Est. Value
About This Home
This home is located at 56 Wilshire Cir, Dracut, MA 01826 and is currently estimated at $778,745, approximately $350 per square foot. 56 Wilshire Cir is a home located in Middlesex County with nearby schools including Joseph A. Campbell Elementary School, Richardson Middle School, and Dracut Senior High School.
Ownership History
Date
Name
Owned For
Owner Type
Purchase Details
Closed on
Mar 27, 2019
Sold by
Cahill Patricia A and Cahill Dennis M
Bought by
Russell Kelley J and Boland Ryan P
Current Estimated Value
Purchase Details
Closed on
Jul 13, 2017
Sold by
2015 Cahill Rt
Bought by
Cahill Dennis M and Cahill Patricia A
Purchase Details
Closed on
Jul 1, 2015
Sold by
Cahill Patricia
Bought by
2015 Cahill Rt
Purchase Details
Closed on
Jun 28, 1988
Sold by
Wheeler Rd Dev
Bought by
Cahill Dennis M
Create a Home Valuation Report for This Property
The Home Valuation Report is an in-depth analysis detailing your home's value as well as a comparison with similar homes in the area
Home Values in the Area
Average Home Value in this Area
Purchase History
| Date | Buyer | Sale Price | Title Company |
|---|---|---|---|
| Russell Kelley J | -- | -- | |
| Cahill Dennis M | -- | -- | |
| 2015 Cahill Rt | -- | -- | |
| Cahill Dennis M | $232,900 | -- |
Source: Public Records
Mortgage History
| Date | Status | Borrower | Loan Amount |
|---|---|---|---|
| Previous Owner | Cahill Dennis M | $196,000 | |
| Previous Owner | Cahill Dennis M | $35,000 | |
| Previous Owner | Cahill Dennis M | $133,000 |
Source: Public Records
Tax History Compared to Growth
Tax History
| Year | Tax Paid | Tax Assessment Tax Assessment Total Assessment is a certain percentage of the fair market value that is determined by local assessors to be the total taxable value of land and additions on the property. | Land | Improvement |
|---|---|---|---|---|
| 2025 | $6,672 | $659,300 | $251,600 | $407,700 |
| 2024 | $6,508 | $622,800 | $239,700 | $383,100 |
| 2023 | $6,305 | $544,500 | $208,500 | $336,000 |
| 2022 | $6,172 | $502,200 | $189,600 | $312,600 |
| 2021 | $6,096 | $468,600 | $172,200 | $296,400 |
| 2020 | $5,898 | $441,800 | $167,000 | $274,800 |
| 2019 | $5,639 | $410,100 | $159,000 | $251,100 |
| 2018 | $5,646 | $399,300 | $159,000 | $240,300 |
| 2017 | $5,456 | $399,300 | $159,000 | $240,300 |
| 2016 | $5,525 | $372,300 | $159,800 | $212,500 |
| 2015 | $5,336 | $357,400 | $159,800 | $197,600 |
| 2014 | $4,995 | $344,700 | $159,800 | $184,900 |
Source: Public Records
Map
Nearby Homes