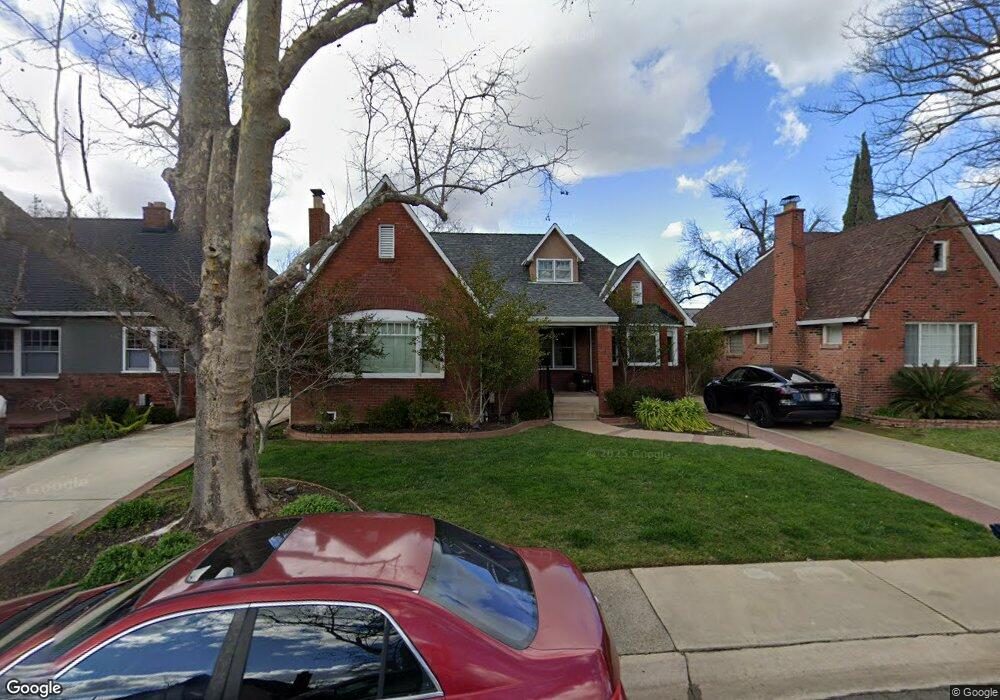
560 Pala Way Sacramento, CA 95819
East Sacramento NeighborhoodEstimated Value: $645,000 - $1,131,000
3
Beds
2
Baths
2,085
Sq Ft
$456/Sq Ft
Est. Value
About This Home
This home is located at 560 Pala Way, Sacramento, CA 95819 and is currently estimated at $950,599, approximately $455 per square foot. 560 Pala Way is a home located in Sacramento County with nearby schools including Caleb Greenwood Elementary, Miwok Middle School, and Hiram W. Johnson High School.
Ownership History
Date
Name
Owned For
Owner Type
Purchase Details
Closed on
Aug 6, 2004
Sold by
Quinn Michael and Blacker Dawn M
Bought by
Quinn Michael A and Blacker Dawn M
Current Estimated Value
Purchase Details
Closed on
Apr 27, 2000
Sold by
Harper Linda Lee
Bought by
Quinn Michael and Blacker Dawn M
Purchase Details
Closed on
Aug 27, 1997
Sold by
Thompson Christopher J and Thompson Julie K
Bought by
Harper Linda Lee
Create a Home Valuation Report for This Property
The Home Valuation Report is an in-depth analysis detailing your home's value as well as a comparison with similar homes in the area
Home Values in the Area
Average Home Value in this Area
Purchase History
| Date | Buyer | Sale Price | Title Company |
|---|---|---|---|
| Quinn Michael A | -- | -- | |
| Quinn Michael | $365,000 | Financial Title Company | |
| Harper Linda Lee | $284,000 | Stewart Title |
Source: Public Records
Tax History Compared to Growth
Tax History
| Year | Tax Paid | Tax Assessment Tax Assessment Total Assessment is a certain percentage of the fair market value that is determined by local assessors to be the total taxable value of land and additions on the property. | Land | Improvement |
|---|---|---|---|---|
| 2025 | $7,479 | $654,266 | $138,314 | $515,952 |
| 2024 | $7,479 | $641,438 | $135,602 | $505,836 |
| 2023 | $7,301 | $628,862 | $132,944 | $495,918 |
| 2022 | $7,177 | $616,533 | $130,338 | $486,195 |
| 2021 | $6,831 | $604,445 | $127,783 | $476,662 |
| 2020 | $6,892 | $598,248 | $126,473 | $471,775 |
| 2019 | $6,743 | $586,519 | $123,994 | $462,525 |
| 2018 | $6,565 | $575,019 | $121,563 | $453,456 |
| 2017 | $6,473 | $563,745 | $119,180 | $444,565 |
| 2016 | $6,373 | $552,693 | $116,844 | $435,849 |
| 2015 | $6,279 | $544,392 | $115,089 | $429,303 |
| 2014 | $6,104 | $533,729 | $112,835 | $420,894 |
Source: Public Records
Map
Nearby Homes