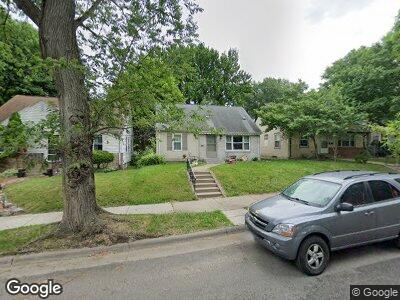
5605 32nd Ave S Minneapolis, MN 55417
Wenonah NeighborhoodEstimated Value: $312,868 - $346,000
3
Beds
1
Bath
1,870
Sq Ft
$176/Sq Ft
Est. Value
About This Home
This home is located at 5605 32nd Ave S, Minneapolis, MN 55417 and is currently estimated at $329,967, approximately $176 per square foot. 5605 32nd Ave S is a home located in Hennepin County with nearby schools including Lake Nokomis Wenonah Elementary School, Lake Nokomis Keewaydin Elementary School, and Sanford Middle School.
Ownership History
Date
Name
Owned For
Owner Type
Purchase Details
Closed on
Aug 9, 2019
Sold by
Thomala Nancy
Bought by
Lyons Cindy
Current Estimated Value
Home Financials for this Owner
Home Financials are based on the most recent Mortgage that was taken out on this home.
Original Mortgage
$256,155
Outstanding Balance
$228,539
Interest Rate
4.12%
Mortgage Type
FHA
Estimated Equity
$101,428
Purchase Details
Closed on
Apr 12, 2018
Sold by
Rec Property Group Llc
Bought by
Lyons Cindy and Thomala Nancy
Home Financials for this Owner
Home Financials are based on the most recent Mortgage that was taken out on this home.
Original Mortgage
$247,456
Interest Rate
5.5%
Mortgage Type
FHA
Purchase Details
Closed on
Nov 22, 2017
Sold by
Ottemess David J and Ottemess Kolteen J H
Bought by
Rec Property Group Llc
Purchase Details
Closed on
Jun 10, 1997
Sold by
Norlin Grace
Bought by
Otterness David and Otterness Kolleen
Create a Home Valuation Report for This Property
The Home Valuation Report is an in-depth analysis detailing your home's value as well as a comparison with similar homes in the area
Home Values in the Area
Average Home Value in this Area
Purchase History
| Date | Buyer | Sale Price | Title Company |
|---|---|---|---|
| Lyons Cindy | -- | Gcs Title | |
| Lyons Cindy | $256,000 | The Title Group Inc | |
| Rec Property Group Llc | $152,000 | The Title Group Inc | |
| Otterness David | $90,200 | -- |
Source: Public Records
Mortgage History
| Date | Status | Borrower | Loan Amount |
|---|---|---|---|
| Open | Lyons Cindy | $6,589 | |
| Open | Lyons Cindy | $26,297 | |
| Open | Lyons Cindy | $256,155 | |
| Previous Owner | Lyons Cindy | $247,456 | |
| Previous Owner | Otterness David J | $100,000 |
Source: Public Records
Tax History Compared to Growth
Tax History
| Year | Tax Paid | Tax Assessment Tax Assessment Total Assessment is a certain percentage of the fair market value that is determined by local assessors to be the total taxable value of land and additions on the property. | Land | Improvement |
|---|---|---|---|---|
| 2023 | $5,565 | $315,000 | $121,000 | $194,000 |
| 2022 | $3,501 | $298,000 | $101,000 | $197,000 |
| 2021 | $3,380 | $259,000 | $59,000 | $200,000 |
| 2020 | $3,622 | $258,500 | $59,300 | $199,200 |
| 2019 | $3,473 | $256,000 | $39,500 | $216,500 |
| 2018 | $3,178 | $232,500 | $39,500 | $193,000 |
| 2017 | $2,974 | $184,500 | $35,900 | $148,600 |
| 2016 | $2,740 | $172,500 | $35,900 | $136,600 |
| 2015 | $2,807 | $168,500 | $35,900 | $132,600 |
| 2014 | -- | $162,500 | $37,500 | $125,000 |
Source: Public Records
Map
Nearby Homes
- 5601 33rd Ave S
- 5548 34th Ave S
- 5509 32nd Ave S
- 3604 E 56th St
- 3525 Boardman St
- 3605 Boardman St
- 5421 30th Ave S
- 5353 30th Ave S
- 3704 Boardman St
- 5608 28th Ave S
- 5428 29th Ave S
- 5625 27th Ave S
- 5624 40th Ave S
- 5341 37th Ave S
- 5537 26th Ave S
- 5452 27th Ave S
- 3916 E 55th St
- 5705 26th Ave S
- 5452 5452 S 27th Ave
- 3900 Boardman St
- 5605 32nd Ave S
- 5601 32nd Ave S
- 5609 32nd Ave S
- 5613 32nd Ave S
- 5601 5601 32nd-Avenue-s
- 5608 5608 32nd-Avenue-s
- 5617 32nd Ave S
- 5553 32nd Ave S
- 5617 5617 32nd-Avenue-s
- 5621 32nd Ave S
- 5604 33rd Ave S
- 5600 33rd Ave S
- 5612 33rd Ave S
- 5553 5553 32nd-Avenue-s
- 5549 32nd Ave S
- 5616 33rd Ave S
- 5612 5612 33rd-Avenue-s
- 5604 32nd Ave S
- 5625 32nd Ave S
- 5600 32nd Ave S