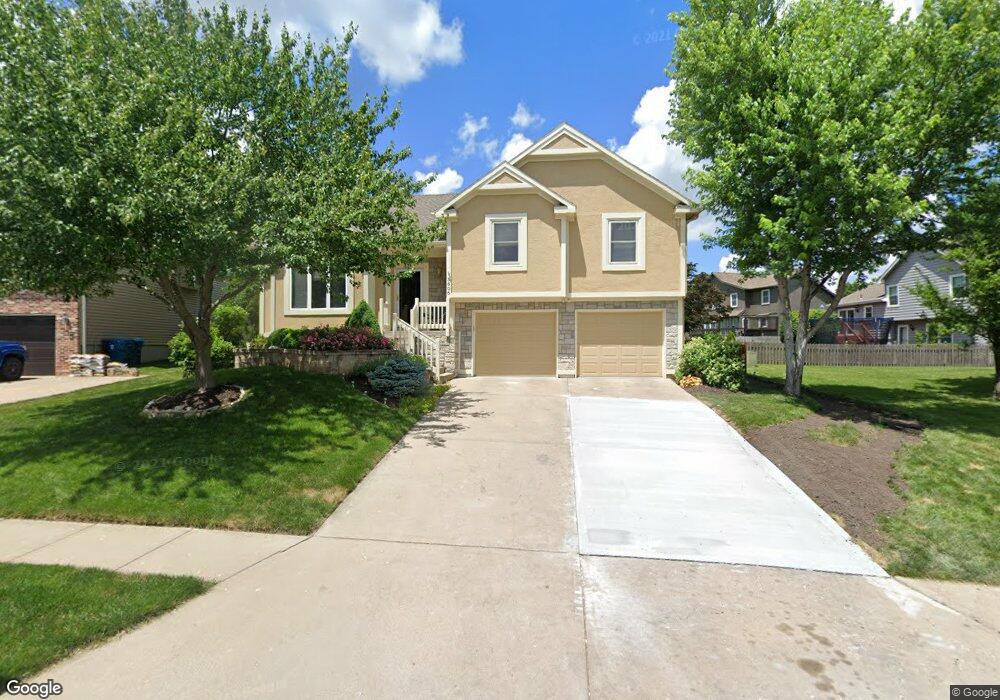
5606 Lakecrest Dr Shawnee, KS 66218
Estimated Value: $391,816 - $422,000
4
Beds
3
Baths
1,520
Sq Ft
$269/Sq Ft
Est. Value
About This Home
This home is located at 5606 Lakecrest Dr, Shawnee, KS 66218 and is currently estimated at $409,204, approximately $269 per square foot. 5606 Lakecrest Dr is a home located in Johnson County with nearby schools including Clear Creek Elementary School, Monticello Trails Middle School, and Mill Valley High School.
Ownership History
Date
Name
Owned For
Owner Type
Purchase Details
Closed on
Nov 10, 2016
Sold by
Rosinski Jenny M and Rosinski Frank D
Bought by
Rosinski Frank D and Rosinski Jenny M
Current Estimated Value
Purchase Details
Closed on
Jan 15, 2010
Sold by
Pittenger Brandon and Anderson Erin
Bought by
Rosinski Jenny M
Purchase Details
Closed on
May 16, 2005
Sold by
Hammonds Rickey and Burnette Teresa
Bought by
Schmutz Shad and Fender Sarah
Purchase Details
Closed on
Jul 16, 2003
Sold by
James Donald R and James Lorinda J
Bought by
Pittenger Brandon and Anderson Erin
Home Financials for this Owner
Home Financials are based on the most recent Mortgage that was taken out on this home.
Original Mortgage
$177,795
Interest Rate
5.19%
Mortgage Type
FHA
Create a Home Valuation Report for This Property
The Home Valuation Report is an in-depth analysis detailing your home's value as well as a comparison with similar homes in the area
Home Values in the Area
Average Home Value in this Area
Purchase History
| Date | Buyer | Sale Price | Title Company |
|---|---|---|---|
| Rosinski Frank D | -- | None Available | |
| Rosinski Jenny M | -- | Cbkc Title & Escrow Llc | |
| Schmutz Shad | -- | Chicago Title Insurance Co | |
| Pittenger Brandon | -- | Chicago Title Insurance Comp |
Source: Public Records
Mortgage History
| Date | Status | Borrower | Loan Amount |
|---|---|---|---|
| Previous Owner | Pittenger Brandon | $177,795 |
Source: Public Records
Tax History Compared to Growth
Tax History
| Year | Tax Paid | Tax Assessment Tax Assessment Total Assessment is a certain percentage of the fair market value that is determined by local assessors to be the total taxable value of land and additions on the property. | Land | Improvement |
|---|---|---|---|---|
| 2024 | $5,220 | $44,954 | $8,808 | $36,146 |
| 2023 | $4,968 | $42,274 | $8,808 | $33,466 |
| 2022 | $4,531 | $37,777 | $7,660 | $30,117 |
| 2021 | $4,374 | $35,017 | $6,963 | $28,054 |
| 2020 | $3,932 | $31,176 | $6,963 | $24,213 |
| 2019 | $3,885 | $30,349 | $5,749 | $24,600 |
| 2018 | $3,612 | $27,957 | $5,749 | $22,208 |
| 2017 | $3,629 | $27,405 | $5,221 | $22,184 |
| 2016 | $3,482 | $25,967 | $4,969 | $20,998 |
| 2015 | $3,430 | $25,185 | $4,969 | $20,216 |
| 2013 | -- | $23,920 | $4,969 | $18,951 |
Source: Public Records
Map
Nearby Homes
- 21217 W 55th Terrace
- 21309 W 56th St
- 21315 W 56th St
- 5405 Lakecrest Dr
- 5725 Marion St
- 5311 Brownridge Dr
- 5307 Noble St
- 21624 W 53rd Terrace
- 5900 Redbud St
- 5817 Millbrook St
- 21804 W 52nd Terrace
- 6031 Lakecrest Dr
- 5402 Roundtree St
- 5206 Round Prairie St
- 6046 Redbud St
- 22209 W 57th St
- 22310 W 58th St
- 5531 Hilltop Dr
- 22115 W 51st Terrace
- 21609 W 61st St
- 5612 Lakecrest Dr
- 21209 W 56th St
- 21217 W 56th St
- 21203 W 56th St
- 5618 Lakecrest Dr
- 21225 W 56th St
- 21231 W 56th St
- 5624 Lakecrest Dr
- 21239 W 56th St
- 5609 Lakecrest Dr
- 5613 Lakecrest Dr
- 21301 W 56th St
- 5605 Lakecrest Dr
- 21305 W 56th St
- 5617 Lakecrest Dr
- 5630 Lakecrest Dr
- 5621 Lakecrest Dr
- 21214 W 56th St
- 21210 W 56th St
- 21206 W 56th St