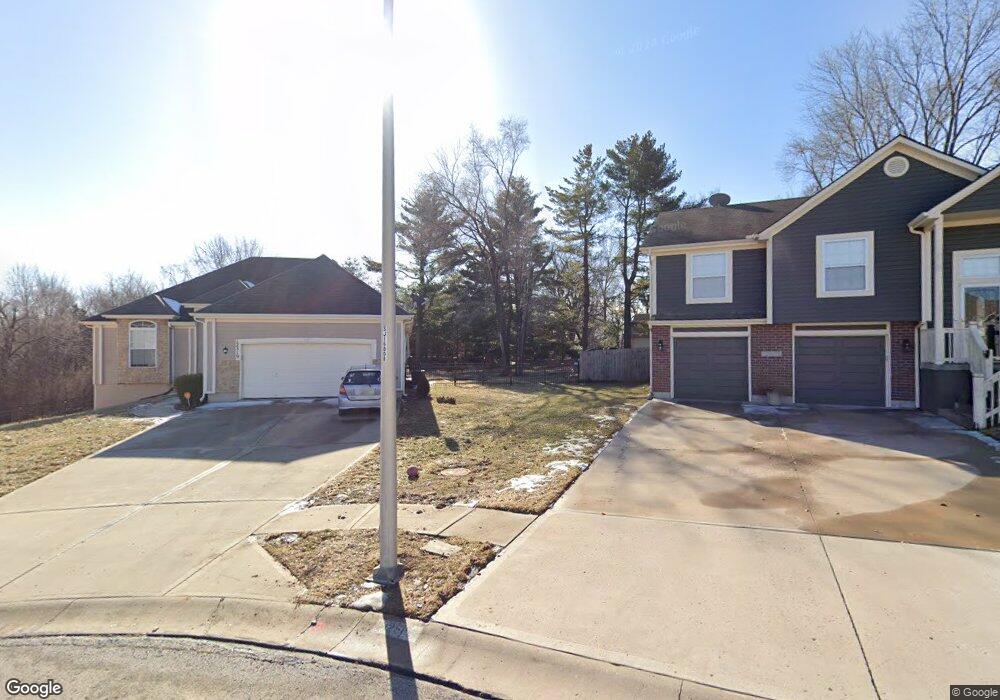
5612 Norfleet Rd Kansas City, MO 64133
Little Blue Valley NeighborhoodEstimated Value: $356,000 - $973,879
5
Beds
4
Baths
5,034
Sq Ft
$130/Sq Ft
Est. Value
About This Home
This home is located at 5612 Norfleet Rd, Kansas City, MO 64133 and is currently estimated at $656,293, approximately $130 per square foot. 5612 Norfleet Rd is a home located in Jackson County with nearby schools including Fleetridge Elementary School, Raytown Middle School, and Raytown South High School.
Ownership History
Date
Name
Owned For
Owner Type
Purchase Details
Closed on
May 24, 2022
Sold by
Hiffeo Investments Inc
Bought by
Graffeo Nicholas Scott
Current Estimated Value
Home Financials for this Owner
Home Financials are based on the most recent Mortgage that was taken out on this home.
Original Mortgage
$719,920
Outstanding Balance
$683,908
Interest Rate
5.25%
Mortgage Type
New Conventional
Estimated Equity
-$27,615
Purchase Details
Closed on
Aug 10, 2021
Sold by
Firtst Land Investments Llc
Bought by
Higgs Scott and Flying H Ranch
Purchase Details
Closed on
Apr 20, 2017
Sold by
Hawthorn Bank
Bought by
Burmeister Steve D
Purchase Details
Closed on
Jun 19, 2015
Sold by
Burmeister Janet L
Bought by
Hiffeo Investments Inc
Home Financials for this Owner
Home Financials are based on the most recent Mortgage that was taken out on this home.
Original Mortgage
$394,000
Interest Rate
5%
Mortgage Type
New Conventional
Create a Home Valuation Report for This Property
The Home Valuation Report is an in-depth analysis detailing your home's value as well as a comparison with similar homes in the area
Home Values in the Area
Average Home Value in this Area
Purchase History
| Date | Buyer | Sale Price | Title Company |
|---|---|---|---|
| Graffeo Nicholas Scott | -- | Platinum Title | |
| Higgs Scott | -- | Chicago Title Ins Co | |
| Burmeister Steve D | -- | None Available | |
| Hiffeo Investments Inc | -- | None Available | |
| Hiffeo Investments Inc | -- | None Available |
Source: Public Records
Mortgage History
| Date | Status | Borrower | Loan Amount |
|---|---|---|---|
| Open | Graffeo Nicholas Scott | $719,920 | |
| Previous Owner | Hiffeo Investments Inc | $394,000 |
Source: Public Records
Tax History Compared to Growth
Tax History
| Year | Tax Paid | Tax Assessment Tax Assessment Total Assessment is a certain percentage of the fair market value that is determined by local assessors to be the total taxable value of land and additions on the property. | Land | Improvement |
|---|---|---|---|---|
| 2025 | $12,437 | $158,021 | $22,521 | $135,500 |
| 2024 | $12,357 | $137,410 | $25,139 | $112,271 |
| 2023 | $12,357 | $137,410 | $5,544 | $131,866 |
| 2022 | $11,785 | $125,970 | $26,949 | $99,021 |
| 2021 | $11,783 | $125,970 | $26,949 | $99,021 |
| 2020 | $10,467 | $110,567 | $26,949 | $83,618 |
| 2019 | $10,269 | $110,567 | $26,949 | $83,618 |
| 2018 | $8,900 | $96,230 | $23,455 | $72,775 |
| 2017 | $8,618 | $96,230 | $23,455 | $72,775 |
| 2016 | $8,618 | $93,819 | $24,443 | $69,376 |
| 2014 | -- | $93,819 | $24,443 | $69,376 |
Source: Public Records
Map
Nearby Homes
- 12909 E 54th Terrace
- 12108 E 57th Terrace
- 12124 E 54th St
- 12417 E 58th Terrace
- 12005 E 57th Terrace
- 12505 E 58th Terrace
- 12915 E 58th St
- 11913 E 57th St
- 12312 E 52nd Terrace S
- 12100 E 52nd Terrace
- 5923 Larson Ave
- 5621 Ridgeway Ave
- 11918 E 59th St
- 6009 Marion Ave
- 12108 E 51st Terrace S
- 5224 Mccoy St
- 6012 Woodside Ave
- 12401 E 51st St S
- 5200 S Delaware Ave
- 11914 E 59th Terrace
- 12519 E 56th St
- 12515 E 56th St
- 12523 E 56th St
- 12509 E 56th St
- 12505 E 56th St
- 12527 E 56th St
- 12518 E 56 St
- 12501 E 56th St
- 12518 E 56th St
- 5620 Marion Cir
- 5621 Marion Cir
- 12508 E 56th St
- 12531 E 56th St
- 12423 E 56th St
- 5624 Marion Cir
- 12504 E 56th St
- 5625 Marion Cir
- 12502 E 56 St
- 5700 Norfleet Rd
- 12526 E 56th St