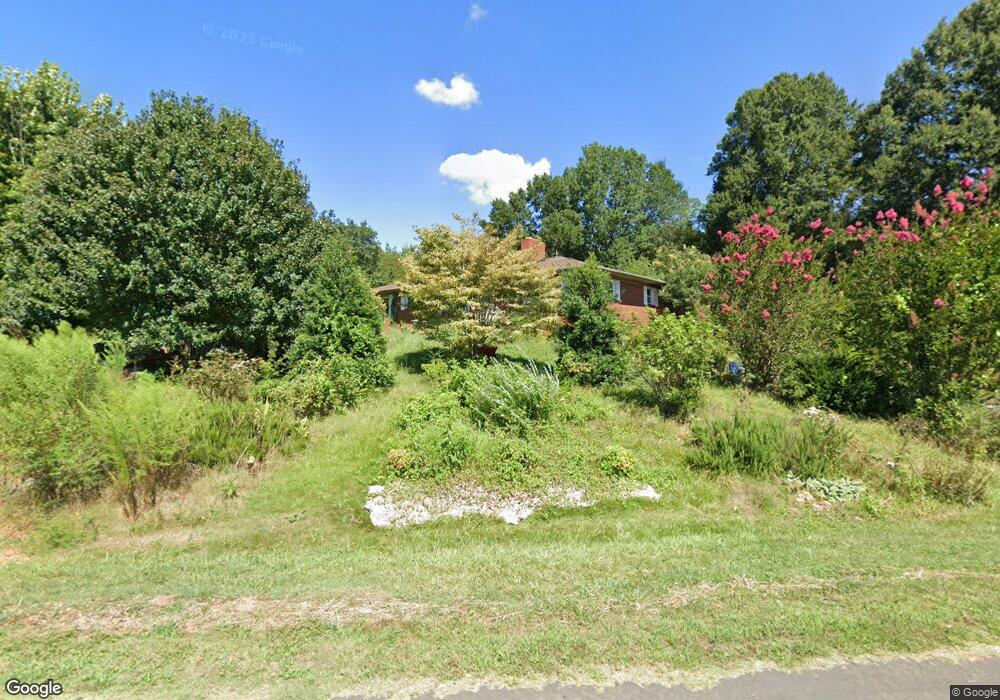
563 Lynch Rd Lincolnton, NC 28092
Estimated Value: $277,000 - $325,000
2
Beds
1
Bath
1,515
Sq Ft
$198/Sq Ft
Est. Value
About This Home
This home is located at 563 Lynch Rd, Lincolnton, NC 28092 and is currently estimated at $299,751, approximately $197 per square foot. 563 Lynch Rd is a home located in Gaston County with nearby schools including Tryon Elementary School, John Chavis Middle School, and Cherryville High School.
Ownership History
Date
Name
Owned For
Owner Type
Purchase Details
Closed on
Apr 12, 2004
Sold by
Cendant Mobility Financial Corp
Bought by
Davenport Lily L
Current Estimated Value
Home Financials for this Owner
Home Financials are based on the most recent Mortgage that was taken out on this home.
Original Mortgage
$127,330
Outstanding Balance
$58,621
Interest Rate
5.35%
Mortgage Type
Purchase Money Mortgage
Estimated Equity
$241,130
Purchase Details
Closed on
Sep 26, 2003
Sold by
Martin Donald H and Martin Sharon J
Bought by
Cendant Mobility Financial Corp
Purchase Details
Closed on
Jun 19, 2000
Sold by
Lynch Bobby K and Lynch Wilma G
Bought by
Martin Donald H and Martin Sharon J
Home Financials for this Owner
Home Financials are based on the most recent Mortgage that was taken out on this home.
Original Mortgage
$35,000
Interest Rate
8.27%
Create a Home Valuation Report for This Property
The Home Valuation Report is an in-depth analysis detailing your home's value as well as a comparison with similar homes in the area
Home Values in the Area
Average Home Value in this Area
Purchase History
| Date | Buyer | Sale Price | Title Company |
|---|---|---|---|
| Davenport Lily L | $119,000 | -- | |
| Cendant Mobility Financial Corp | $132,000 | -- | |
| Martin Donald H | $105,000 | -- |
Source: Public Records
Mortgage History
| Date | Status | Borrower | Loan Amount |
|---|---|---|---|
| Open | Davenport Lily L | $127,330 | |
| Previous Owner | Martin Donald H | $35,000 |
Source: Public Records
Tax History Compared to Growth
Tax History
| Year | Tax Paid | Tax Assessment Tax Assessment Total Assessment is a certain percentage of the fair market value that is determined by local assessors to be the total taxable value of land and additions on the property. | Land | Improvement |
|---|---|---|---|---|
| 2025 | $1,545 | $216,380 | $21,220 | $195,160 |
| 2024 | $1,532 | $214,540 | $21,220 | $193,320 |
| 2023 | $1,491 | $214,540 | $21,220 | $193,320 |
| 2022 | $1,139 | $123,770 | $16,400 | $107,370 |
| 2021 | $1,156 | $123,770 | $16,400 | $107,370 |
| 2019 | $1,168 | $123,770 | $16,400 | $107,370 |
| 2018 | $982 | $100,944 | $17,265 | $83,679 |
| 2017 | $986 | $100,944 | $17,265 | $83,679 |
| 2016 | $986 | $101,334 | $0 | $0 |
| 2014 | $945 | $97,078 | $21,150 | $75,928 |
Source: Public Records
Map
Nearby Homes
- 3156 Long Shoals Rd
- 141 Rash Rd
- 2988 Wesleyan Church Rd
- 2641 Southside Rd
- 2913 & 2901 Wesleyan Church Rd
- 511 Colorado Trail
- 2510 Burton Estates Ln
- 848 Ike Lynch Rd
- 0 Gaston-Webbs Chapel Rd
- 3076 Gates Rd
- 155 Golden Aster Dr
- 2503 Tin Mine Rd
- Hudson Plan at Autumn Ridge
- Baxter Plan at Autumn Ridge
- TA3000 Plan at Autumn Ridge
- TA4000 Plan at Autumn Ridge
- Gideon Plan at Autumn Ridge
- Huntley Plan at Autumn Ridge
- Abigale Plan at Autumn Ridge
- Whitney Plan at Autumn Ridge
- 612 Lynch Rd Unit 5
- 612 Lynch Rd Unit 4
- 612 Lynch Rd Unit 1
- 612 Lynch Rd Unit 2
- 612 Lynch Rd Unit 3
- 612 Lynch Rd
- 560 Lynch Rd
- 531 Lynch Rd
- 1650 Long Shoals Rd
- 1806 Long Shoals Rd
- 613 Lynch Rd
- 1632 Long Shoals Rd
- 622 Lynch Rd
- 1639 Long Shoals Rd
- 627 Lynch Rd
- 1817 Long Shoals Rd
- 633 Lynch Rd
- 639 Lynch Rd
- 643 Lynch Rd
- 1829 Long Shoals Rd