5646 109th Ave Pullman, MI 49450
Estimated Value: $68,883 - $134,000
1
Bed
1
Bath
768
Sq Ft
$122/Sq Ft
Est. Value
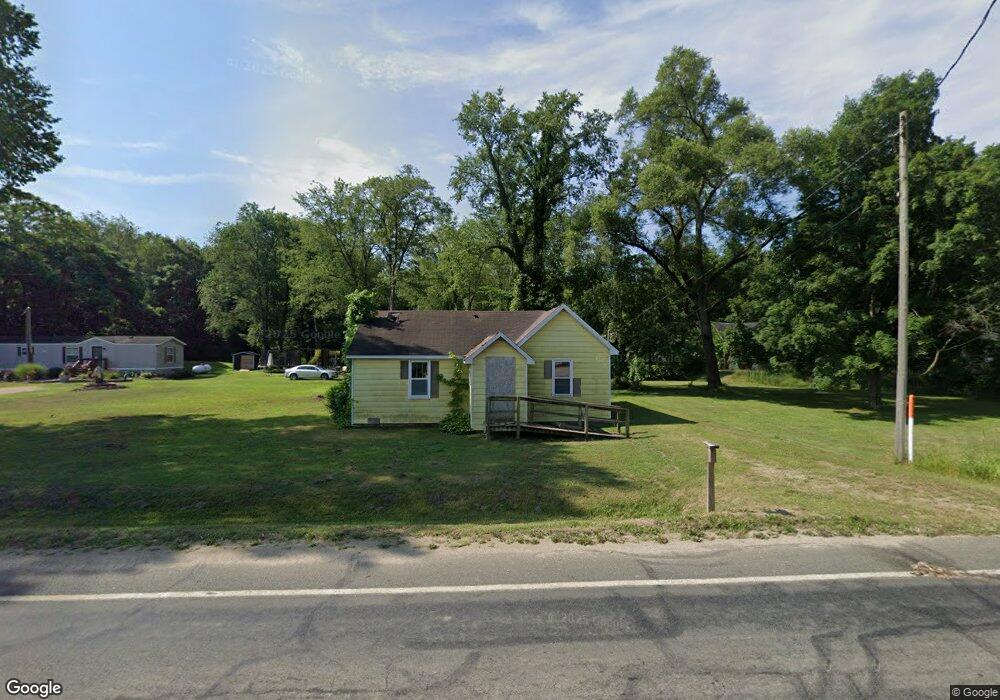
About This Home
This home is located at 5646 109th Ave, Pullman, MI 49450 and is currently estimated at $93,971, approximately $122 per square foot. 5646 109th Ave is a home located in Allegan County with nearby schools including Bloomingdale High School.
Ownership History
Date
Name
Owned For
Owner Type
Purchase Details
Closed on
Aug 23, 2014
Sold by
Real Estate Exchange Of Holland Inc
Bought by
Perales Anselmo and Salazar Nayeli
Current Estimated Value
Purchase Details
Closed on
Aug 7, 2014
Sold by
Fulbright Mary
Bought by
Real Estate Exchange Of Holland Inc
Purchase Details
Closed on
Oct 3, 2012
Sold by
Conlin Peter L
Bought by
Fulbright Mary
Create a Home Valuation Report for This Property
The Home Valuation Report is an in-depth analysis detailing your home's value as well as a comparison with similar homes in the area
Purchase History
| Date | Buyer | Sale Price | Title Company |
|---|---|---|---|
| Perales Anselmo | -- | None Available | |
| Real Estate Exchange Of Holland Inc | $12,000 | Nations Title Agency | |
| Fulbright Mary | $28,000 | Devon Title Agency | |
| Fulbright Mary | -- | Devon Title Agency |
Source: Public Records
Tax History
| Year | Tax Paid | Tax Assessment Tax Assessment Total Assessment is a certain percentage of the fair market value that is determined by local assessors to be the total taxable value of land and additions on the property. | Land | Improvement |
|---|---|---|---|---|
| 2025 | $444 | $9,100 | $7,700 | $1,400 |
| 2024 | $346 | $8,800 | $7,400 | $1,400 |
| 2023 | $346 | $8,700 | $7,300 | $1,400 |
| 2022 | $346 | $7,800 | $6,400 | $1,400 |
| 2020 | $365 | $7,300 | $5,900 | $1,400 |
| 2019 | $352 | $7,200 | $5,900 | $1,300 |
| 2018 | $0 | $6,700 | $5,600 | $1,100 |
| 2017 | $0 | $6,300 | $5,200 | $1,100 |
| 2016 | $0 | $6,100 | $4,900 | $1,200 |
| 2015 | -- | $6,100 | $4,900 | $1,200 |
| 2014 | -- | $16,900 | $5,200 | $11,700 |
| 2013 | -- | $20,400 | $4,900 | $15,500 |
Source: Public Records
Map
Nearby Homes
Your Personal Tour Guide
Ask me questions while you tour the home.