5648 N Montpelier Rd Denair, CA 95316
Estimated payment $26,605/month
Total Views
1,336
403.18
Acres
$12,401
Price per Acre
17,562,520
Sq Ft Lot
About This Lot
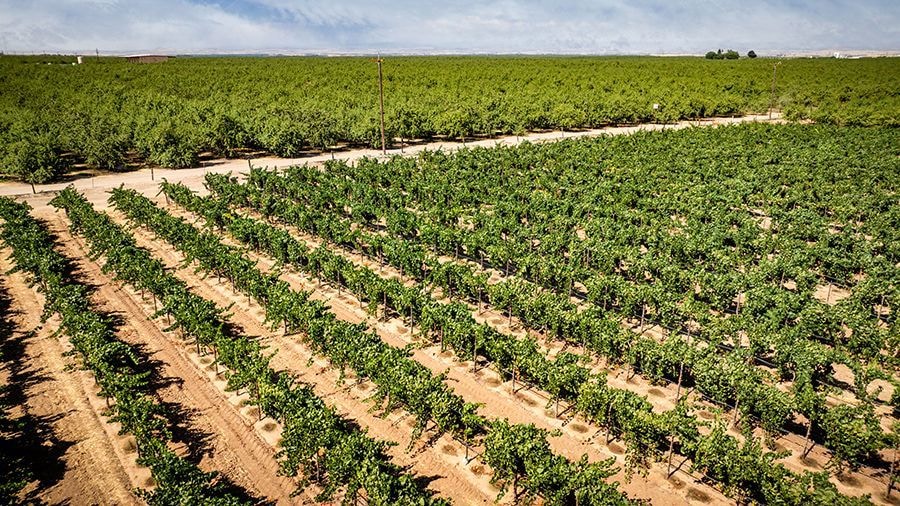
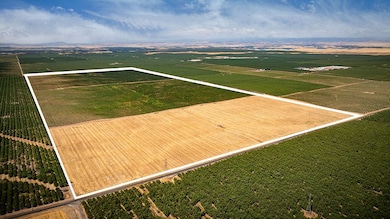
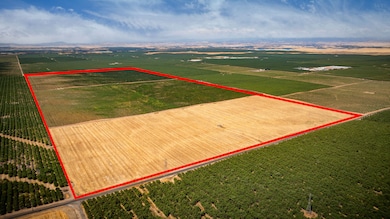
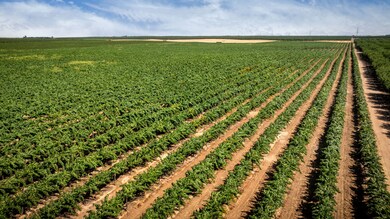
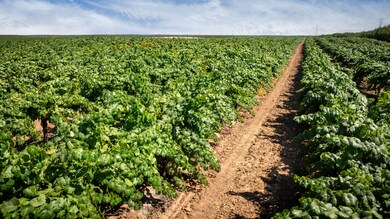
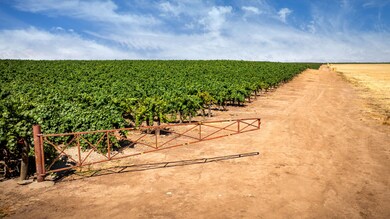
Hawkins Ranch Property Highlights:
403.18 +/- Gross Assessed Acres located in Stanislaus County and California Grape Pricing District 12
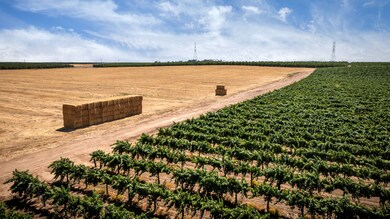
314 +/- Planted Vineyard Acres
78 +/- Plantable open land Acres
11.18 +/- Acres of Supporting and Ancillary Land
Property is not enrolled in a Williamson Act Contract
Planted winegrape varietals include:
Chardonnay (178 Acres), Tannat (136 Acres)
Chardonnay (p. 2021), Tannat (p. 2001)
2025 projected yields at 10 tons per acre
Located in the Eastside Water District.
Purchase Price: $5,000,000 all cash at the close of escrow ($12,401 per gross acre)
Listing Provided By

Property Details
Property Type
- Land
Est. Annual Taxes
- $2,394
Lot Details
- Current uses include agriculture, commercial, orchard/vineyards, vineyard, orchard
- Potential uses include agriculture, dairy, grazing, orchards/vineyards
Map
Create a Home Valuation Report for This Property
The Home Valuation Report is an in-depth analysis detailing your home's value as well as a comparison with similar homes in the area
Home Values in the Area
Average Home Value in this Area
Tax History
| Year | Tax Paid | Tax Assessment Tax Assessment Total Assessment is a certain percentage of the fair market value that is determined by local assessors to be the total taxable value of land and additions on the property. | Land | Improvement |
|---|---|---|---|---|
| 2025 | $2,394 | $154,602 | $143,013 | $11,589 |
| 2024 | $2,081 | $151,571 | $140,209 | $11,362 |
| 2023 | $2,022 | $148,600 | $137,460 | $11,140 |
| 2022 | $1,338 | $89,515 | $83,167 | $6,348 |
| 2021 | $1,326 | $87,761 | $81,537 | $6,224 |
| 2020 | $1,307 | $86,862 | $80,701 | $6,161 |
| 2019 | $1,246 | $85,160 | $79,119 | $6,041 |
| 2018 | $1,243 | $83,491 | $77,568 | $5,923 |
| 2017 | $1,207 | $81,855 | $76,048 | $5,807 |
| 2016 | $1,203 | $80,251 | $74,557 | $5,694 |
| 2015 | $1,148 | $79,047 | $73,438 | $5,609 |
| 2014 | $778 | $44,752 | $38,363 | $6,389 |
Source: Public Records
Property History
| Date | Event | Price | List to Sale | Price per Sq Ft | Prior Sale |
|---|---|---|---|---|---|
| 08/28/2025 08/28/25 | For Sale | $4,000,000 | -20.0% | -- | |
| 08/28/2025 08/28/25 | For Sale | $5,000,000 | +3746.2% | -- | |
| 09/02/2022 09/02/22 | Sold | $130,000 | -18.8% | $417 / Sq Ft | View Prior Sale |
| 08/18/2022 08/18/22 | Pending | -- | -- | -- | |
| 07/20/2022 07/20/22 | Price Changed | $160,000 | -20.0% | $513 / Sq Ft | |
| 06/02/2022 06/02/22 | Price Changed | $200,000 | -11.1% | $641 / Sq Ft | |
| 05/19/2022 05/19/22 | Price Changed | $225,000 | -8.2% | $721 / Sq Ft | |
| 05/11/2022 05/11/22 | For Sale | $245,000 | -- | $785 / Sq Ft |
Purchase History
| Date | Type | Sale Price | Title Company |
|---|---|---|---|
| Grant Deed | $130,000 | First American Title Company | |
| Deed | -- | -- | |
| Grant Deed | -- | None Available | |
| Quit Claim Deed | -- | -- |
Source: Public Records
Nearby Homes
- 0 E Keyes Rd Unit 225122727
- 0 E Keyes Rd Unit 225037976
- 0 E Keyes Rd Unit MC25067971
- E Keyes Rd
- 0 E Monte Vista Ave Unit 225128343
- 15453 E Monte Vista Ave
- 17431 E Keyes Rd
- 15309 E Keyes Rd
- 4910 E Zeering Rd
- 1477 Hidden Hills Rd
- 4625 E Monte Vista Ave
- 2912 Marazan St
- 4513 E Tuolumne Rd
- 13118 6th St
- 13119 6th St
- 18624 Lake Rd
- 955 Elma St
- 3620 E Monte Vista Ave
- 7461 East Ave
- 3418 N Waring Rd Unit 71
- 2481 E Canal Dr Unit Sunshine Studio
- 2471 E Canal Dr Unit Sequoia studio
- 114 Baker St
- 114 Baker St
- 1403 E Monte Vista Ave
- 2090 N Berkeley Ave
- 12321 Bentley St
- 4610 Fosberg Rd
- 1749 N Olive Ave
- 351 E Monte Vista Ave
- 3108 James Ln
- 3661 La Mancha Place
- 3639 Nicole Ct
- 275 E Minnesota Ave
- 267 W Springer Dr
- 303 Wayside Dr
- 4125 Pathway Ln
- 3155 Niagra St
- 3155 Niagra St
- 3155 Niagra St