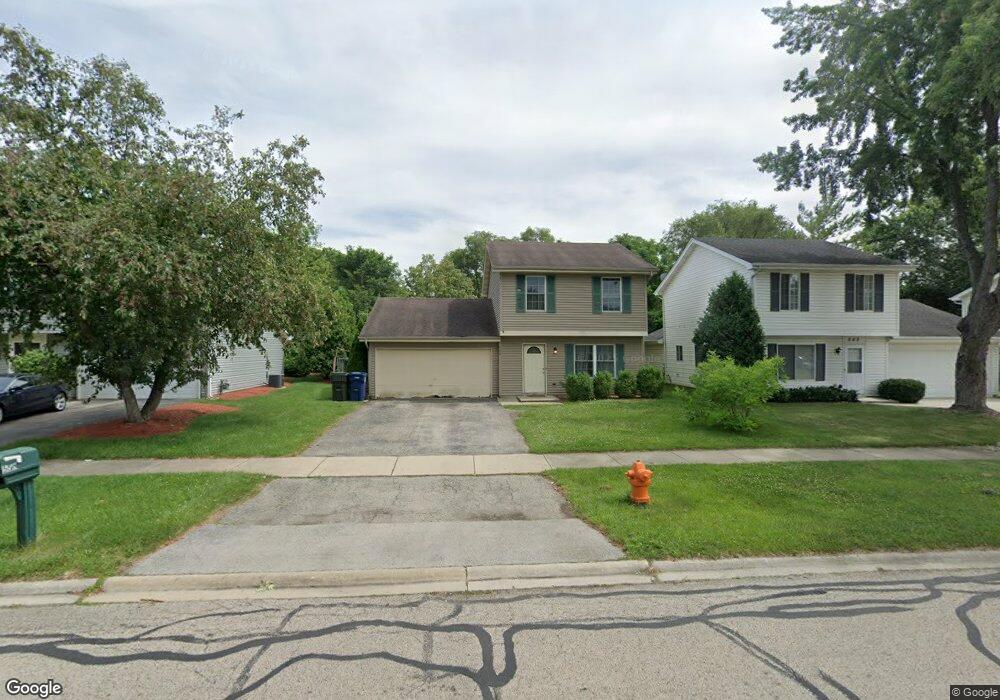
566 Springhill Cir Naperville, IL 60563
Springhill NeighborhoodEstimated Value: $388,000 - $416,000
--
Bed
1
Bath
1,602
Sq Ft
$250/Sq Ft
Est. Value
About This Home
This home is located at 566 Springhill Cir, Naperville, IL 60563 and is currently estimated at $399,951, approximately $249 per square foot. 566 Springhill Cir is a home located in DuPage County with nearby schools including Ellsworth Elementary School, Washington Jr High School, and Naperville North High School.
Ownership History
Date
Name
Owned For
Owner Type
Purchase Details
Closed on
Dec 15, 2004
Sold by
Merritt Robert and Merritt Karolyn
Bought by
Pedersen Michael A
Current Estimated Value
Home Financials for this Owner
Home Financials are based on the most recent Mortgage that was taken out on this home.
Original Mortgage
$173,600
Outstanding Balance
$124,017
Interest Rate
5%
Mortgage Type
Purchase Money Mortgage
Estimated Equity
$275,934
Purchase Details
Closed on
Jun 19, 1998
Sold by
Ripp Steven C
Bought by
Merritt Robert and Merritt Karolyn
Home Financials for this Owner
Home Financials are based on the most recent Mortgage that was taken out on this home.
Original Mortgage
$113,900
Interest Rate
8.75%
Purchase Details
Closed on
Mar 25, 1994
Sold by
Thacker Rick L and Thacker Susan A
Bought by
Ripp Steven C
Home Financials for this Owner
Home Financials are based on the most recent Mortgage that was taken out on this home.
Original Mortgage
$119,200
Interest Rate
7.17%
Create a Home Valuation Report for This Property
The Home Valuation Report is an in-depth analysis detailing your home's value as well as a comparison with similar homes in the area
Home Values in the Area
Average Home Value in this Area
Purchase History
| Date | Buyer | Sale Price | Title Company |
|---|---|---|---|
| Pedersen Michael A | $217,000 | Ctic | |
| Merritt Robert | $134,000 | Intercounty Title | |
| Ripp Steven C | $125,500 | First American Title Insuran |
Source: Public Records
Mortgage History
| Date | Status | Borrower | Loan Amount |
|---|---|---|---|
| Open | Pedersen Michael A | $173,600 | |
| Previous Owner | Merritt Robert | $113,900 | |
| Previous Owner | Ripp Steven C | $119,200 | |
| Closed | Pedersen Michael A | $43,400 |
Source: Public Records
Tax History Compared to Growth
Tax History
| Year | Tax Paid | Tax Assessment Tax Assessment Total Assessment is a certain percentage of the fair market value that is determined by local assessors to be the total taxable value of land and additions on the property. | Land | Improvement |
|---|---|---|---|---|
| 2024 | $6,264 | $110,250 | $47,992 | $62,258 |
| 2023 | $6,018 | $100,620 | $43,800 | $56,820 |
| 2022 | $5,666 | $93,540 | $40,720 | $52,820 |
| 2021 | $5,452 | $90,000 | $39,180 | $50,820 |
| 2020 | $5,334 | $88,390 | $38,480 | $49,910 |
| 2019 | $5,172 | $84,570 | $36,820 | $47,750 |
| 2018 | $4,958 | $81,310 | $35,400 | $45,910 |
| 2017 | $4,853 | $78,570 | $34,210 | $44,360 |
| 2016 | $4,750 | $75,730 | $32,970 | $42,760 |
| 2015 | $4,709 | $71,320 | $31,050 | $40,270 |
| 2014 | $4,671 | $68,750 | $29,930 | $38,820 |
| 2013 | $4,601 | $68,910 | $30,000 | $38,910 |
Source: Public Records
Map
Nearby Homes
- 1314 Haverhill Cir
- 1068 Mattande Ln
- 25W257 Gunston Ave
- 1140 Brighton Rd
- 904 Coletta Cir
- 3 Westmoreland Ln
- 5S504 Radcliff Rd
- 839 Mt Vernon Ct
- 1133 Catherine Ave
- 32 Westmoreland Ln
- 5S583 Tuthill Rd
- 130 N Huffman St
- 5S761 Malibu Ln
- 5S300 Tuthill Rd
- 5S730 Malibu Ln
- 5S365 Vest Ave
- 210 Westmoreland Ln
- 26W250 Case St
- 5125 Radcliff Rd
- 24W681 Woodcrest Dr
- 562 Springhill Cir
- 572 Springhill Cir
- 556 Springhill Cir
- 582 Springhill Cir
- 542 Springhill Cir
- 591 Springhill Cir
- 583 Springhill Cir
- 571 Springhill Cir
- 1248 Brookline Ct
- 536 Springhill Cir
- 563 Springhill Cir
- 603 Springhill Cir
- 551 Springhill Cir
- 1252 Brookline Ct
- 532 Springhill Cir
- 615 Springhill Cir
- 543 Springhill Cir
- 526 Springhill Cir
- 1256 Brookline Ct
- 531 Springhill Cir