5675 Cielo Ave Goleta, CA 93117
East Goleta Valley NeighborhoodEstimated Value: $1,819,000 - $2,356,000
3
Beds
3
Baths
2,416
Sq Ft
$878/Sq Ft
Est. Value
About This Home
This home is located at 5675 Cielo Ave, Goleta, CA 93117 and is currently estimated at $2,122,089, approximately $878 per square foot. 5675 Cielo Ave is a home located in Santa Barbara County with nearby schools including Mountain View Elementary School, Goleta Valley Junior High School, and Dos Pueblos Senior High School.
Ownership History
Date
Name
Owned For
Owner Type
Purchase Details
Closed on
Nov 7, 2024
Sold by
Mark C Shier Trust and Langan Susan Marie
Bought by
Langan Susan M
Current Estimated Value
Purchase Details
Closed on
Apr 12, 2019
Sold by
Shier Mark C
Bought by
Shier Mark C and Mark C Shier Trust
Purchase Details
Closed on
Apr 24, 2002
Sold by
Renna John and Renna Linda
Bought by
Shier Mark C and Langan Susan M
Home Financials for this Owner
Home Financials are based on the most recent Mortgage that was taken out on this home.
Original Mortgage
$704,000
Interest Rate
7.18%
Purchase Details
Closed on
Jul 21, 2000
Sold by
Renna John F and Renna Linda A
Bought by
Renna John and Renna Linda
Purchase Details
Closed on
Mar 24, 1999
Sold by
Horne Jeffrey T
Bought by
Renna John F and Renna Linda A
Home Financials for this Owner
Home Financials are based on the most recent Mortgage that was taken out on this home.
Original Mortgage
$330,000
Interest Rate
7.1%
Create a Home Valuation Report for This Property
The Home Valuation Report is an in-depth analysis detailing your home's value as well as a comparison with similar homes in the area
Home Values in the Area
Average Home Value in this Area
Purchase History
| Date | Buyer | Sale Price | Title Company |
|---|---|---|---|
| Langan Susan M | -- | None Listed On Document | |
| Langan Susan M | -- | None Listed On Document | |
| Shier Mark C | -- | None Available | |
| Shier Mark C | $880,000 | First American Title Co | |
| Renna John | -- | -- | |
| Renna John F | $581,500 | Lawyers Title Company |
Source: Public Records
Mortgage History
| Date | Status | Borrower | Loan Amount |
|---|---|---|---|
| Previous Owner | Shier Mark C | $704,000 | |
| Previous Owner | Renna John F | $330,000 |
Source: Public Records
Tax History
| Year | Tax Paid | Tax Assessment Tax Assessment Total Assessment is a certain percentage of the fair market value that is determined by local assessors to be the total taxable value of land and additions on the property. | Land | Improvement |
|---|---|---|---|---|
| 2025 | $13,918 | $1,300,007 | $701,711 | $598,296 |
| 2023 | $13,918 | $1,249,527 | $674,463 | $575,064 |
| 2022 | $13,470 | $1,225,028 | $661,239 | $563,789 |
| 2021 | $13,250 | $1,201,009 | $648,274 | $552,735 |
| 2020 | $12,903 | $1,188,695 | $641,627 | $547,068 |
| 2019 | $12,670 | $1,165,389 | $629,047 | $536,342 |
| 2018 | $12,415 | $1,142,539 | $616,713 | $525,826 |
| 2017 | $12,202 | $1,120,137 | $604,621 | $515,516 |
| 2016 | $11,839 | $1,098,174 | $592,766 | $505,408 |
| 2014 | $11,556 | $1,060,492 | $572,426 | $488,066 |
Source: Public Records
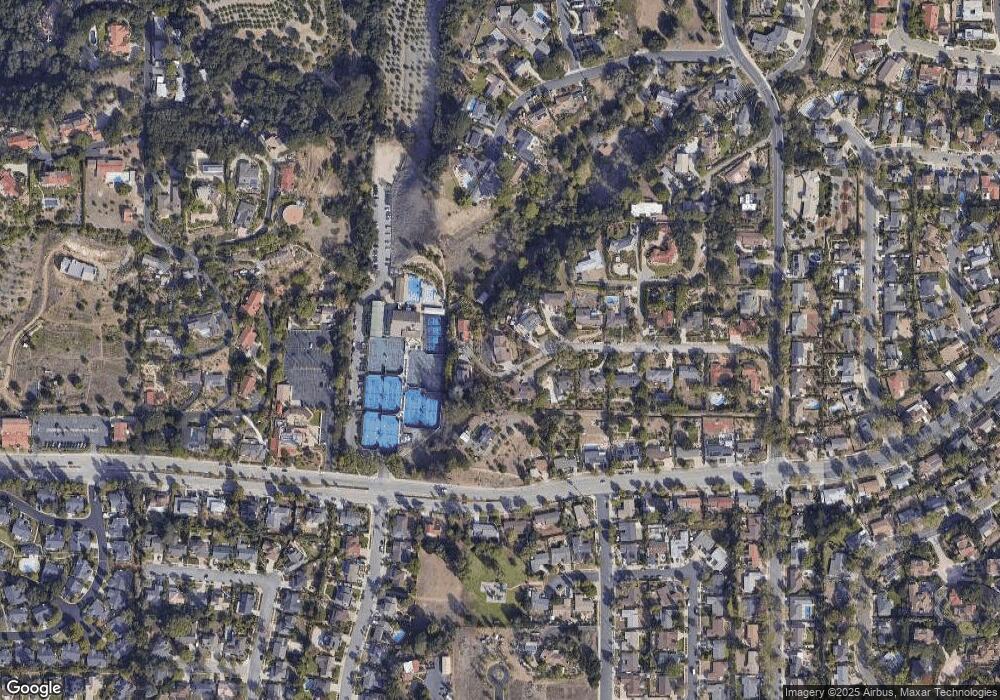
Map
Nearby Homes
- 655 Camino Campana
- 00 N Fairview Ave
- 673 Rossmore Rd
- 305 Lexington Ave
- 5573 Huntington Dr
- 0 N Fairview Ave Unit SR24087795
- 777 Avenida Pequena
- 5722 Encina Rd Unit 3
- 257 Moreton Bay Ln Unit 2
- 257 Moreton Bay Ln
- 5740 Encina Rd Unit 3
- 5474 Berkeley Rd
- 5930 Encina Rd
- 1256 Camino Palomera
- 5357 Paseo Orlando
- 1500 Camino Meleno
- 5377 Agana Dr
- 37 Dearborn Place Unit 81
- 5518 Armitos Ave Unit 86
- 5510 Armitos Ave Unit 4
- 5671 Cielo Ave
- 5667 Cielo Ave
- 5670 Cielo Dr
- 5670 Cielo Ave
- 5665 Cielo Ave
- 5663 Cielo Ave
- 5660 Cielo Ave
- 5650 Cielo Ave
- 5651 Cielo Ave
- 725 Cambridge Dr
- 5712 Cathedral Oaks Rd
- 5722 Cathedral Oaks Rd
- 5640 Cielo Ave
- 5638 Cielo Ave
- 5641 Cielo Ave
- 5702 Cathedral Oaks Rd
- 5699 Via Salerno
- 5634 Cielo Ave
- 5688 Cathedral Oaks Rd
- 5630 Cielo Ave
Your Personal Tour Guide
Ask me questions while you tour the home.