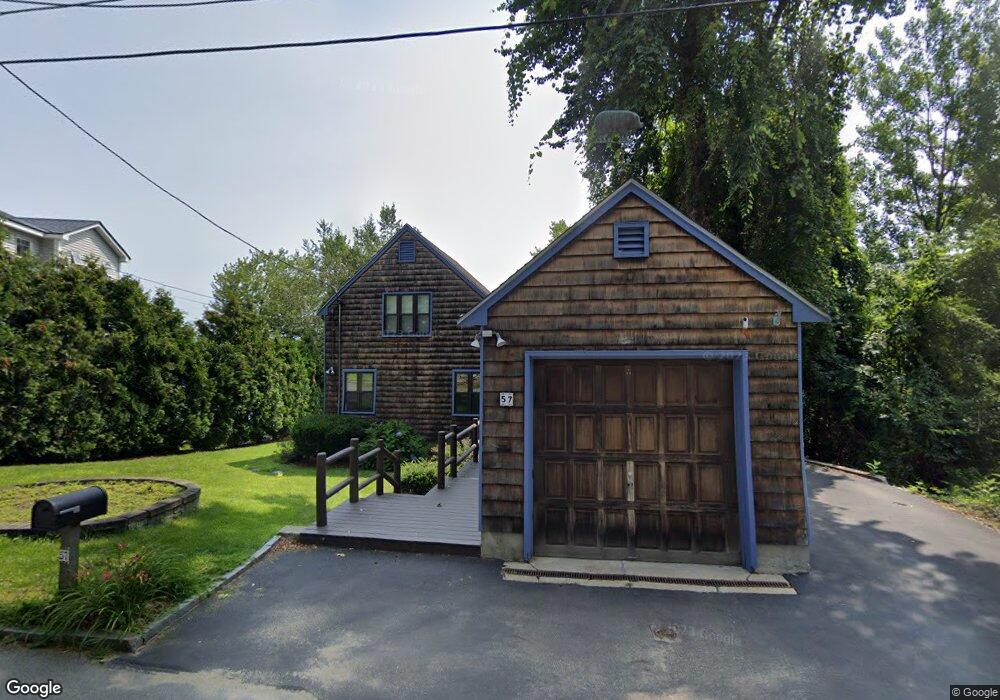
57 W Shore Rd Windham, NH 03087
Estimated Value: $645,430 - $838,000
3
Beds
3
Baths
1,320
Sq Ft
$560/Sq Ft
Est. Value
About This Home
This home is located at 57 W Shore Rd, Windham, NH 03087 and is currently estimated at $738,608, approximately $559 per square foot. 57 W Shore Rd is a home located in Rockingham County with nearby schools including Golden Brook Elementary School, Windham Middle School, and Windham High School.
Ownership History
Date
Name
Owned For
Owner Type
Purchase Details
Closed on
Aug 23, 2022
Sold by
Mcgivern 2013 Irt
Bought by
Weihrauch Margaret S
Current Estimated Value
Purchase Details
Closed on
Aug 15, 2017
Sold by
Weihrauch Margaret S
Bought by
Mcgivern 2017 Irt
Purchase Details
Closed on
Mar 4, 2013
Sold by
Mcgivern Teresa A
Bought by
Mcgiver Irt
Purchase Details
Closed on
Nov 7, 1986
Bought by
Mcgiver Irt
Create a Home Valuation Report for This Property
The Home Valuation Report is an in-depth analysis detailing your home's value as well as a comparison with similar homes in the area
Home Values in the Area
Average Home Value in this Area
Purchase History
| Date | Buyer | Sale Price | Title Company |
|---|---|---|---|
| Weihrauch Margaret S | -- | None Available | |
| Mcgivern 2017 Irt | -- | -- | |
| Weihracuh Margaret S | -- | -- | |
| Mcgiver Irt | -- | -- | |
| Mcgiver Irt | -- | -- |
Source: Public Records
Tax History Compared to Growth
Tax History
| Year | Tax Paid | Tax Assessment Tax Assessment Total Assessment is a certain percentage of the fair market value that is determined by local assessors to be the total taxable value of land and additions on the property. | Land | Improvement |
|---|---|---|---|---|
| 2024 | $10,507 | $464,100 | $313,500 | $150,600 |
| 2023 | $9,932 | $464,100 | $313,500 | $150,600 |
| 2022 | $9,171 | $464,100 | $313,500 | $150,600 |
| 2021 | $8,642 | $464,100 | $313,500 | $150,600 |
| 2020 | $8,878 | $464,100 | $313,500 | $150,600 |
| 2019 | $8,558 | $379,500 | $264,800 | $114,700 |
| 2018 | $8,839 | $379,500 | $264,800 | $114,700 |
| 2017 | $7,666 | $379,500 | $264,800 | $114,700 |
| 2016 | $8,281 | $379,500 | $264,800 | $114,700 |
| 2015 | $8,243 | $379,500 | $264,800 | $114,700 |
| 2014 | $8,940 | $372,500 | $246,000 | $126,500 |
| 2013 | $8,529 | $361,400 | $246,000 | $115,400 |
Source: Public Records
Map
Nearby Homes
- 24 Rolling Ridge Rd
- 95 Lake Shore Rd
- 3 S Shore Rd
- 108 S Shore Rd
- 174 N Policy St
- 25 Range Rd
- 6 Chadwick Cir
- 1 Squire Armour Rd
- 10 Roulston Rd
- 54 Enterprise Dr
- 10 Harris Rd
- 17 Clinton St
- 11 Sullivan Ct
- 15 Enterprise Dr
- 133 Brookdale Rd
- 70 Governor Dinsmore Rd
- 17 Cole Rd
- 2 Dennison Ave
- 10 1st St
- 63 Searles Rd