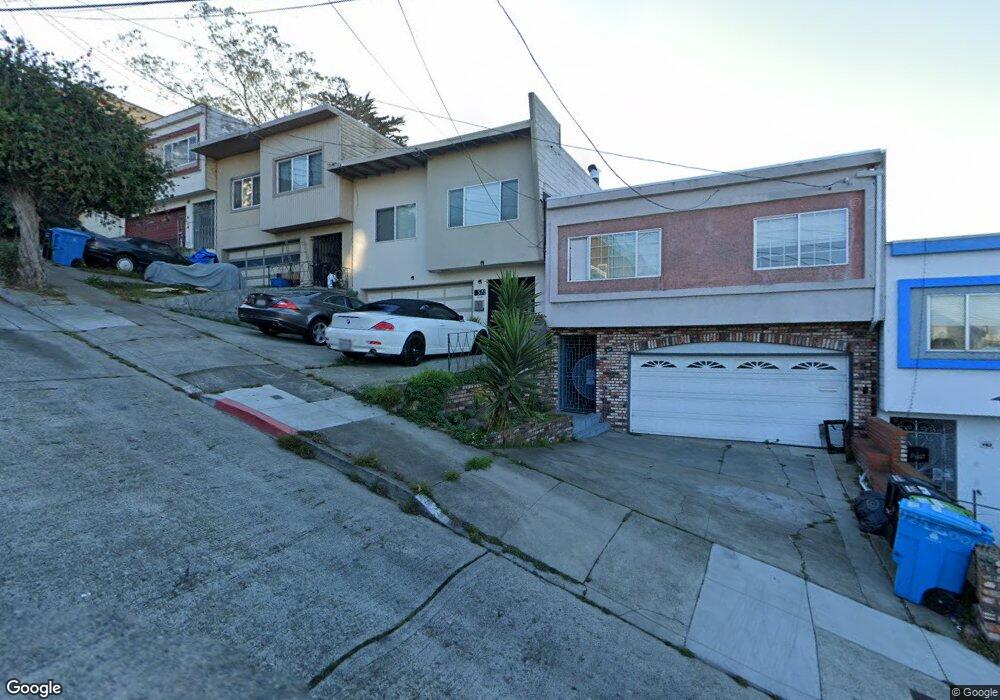
571 Orizaba Ave San Francisco, CA 94132
Merced Heights NeighborhoodEstimated Value: $856,000 - $1,468,000
3
Beds
2
Baths
1,309
Sq Ft
$859/Sq Ft
Est. Value
About This Home
This home is located at 571 Orizaba Ave, San Francisco, CA 94132 and is currently estimated at $1,124,626, approximately $859 per square foot. 571 Orizaba Ave is a home located in San Francisco County with nearby schools including Ortega (Jose) Elementary School, Aptos Middle School, and Leadership High School.
Ownership History
Date
Name
Owned For
Owner Type
Purchase Details
Closed on
Feb 20, 2019
Sold by
Lo Lance and Lance Lo Revocable Trust
Bought by
Lo Lance and Lance Lo Revocable Trust
Current Estimated Value
Home Financials for this Owner
Home Financials are based on the most recent Mortgage that was taken out on this home.
Original Mortgage
$466,650
Outstanding Balance
$409,432
Interest Rate
4.4%
Mortgage Type
New Conventional
Estimated Equity
$715,194
Purchase Details
Closed on
Aug 8, 2005
Sold by
Lo Lance L
Bought by
Lo Lance
Purchase Details
Closed on
May 7, 1997
Sold by
Monk John Ray
Bought by
Banks Sonya Theresa
Purchase Details
Closed on
May 6, 1997
Sold by
Banks Sonya T
Bought by
Lo Lance L
Create a Home Valuation Report for This Property
The Home Valuation Report is an in-depth analysis detailing your home's value as well as a comparison with similar homes in the area
Home Values in the Area
Average Home Value in this Area
Purchase History
| Date | Buyer | Sale Price | Title Company |
|---|---|---|---|
| Lo Lance | -- | Servicelink | |
| Lo Lance | -- | -- | |
| Banks Sonya Theresa | -- | First American Title Co | |
| Lo Lance L | $197,000 | First American Title Co |
Source: Public Records
Mortgage History
| Date | Status | Borrower | Loan Amount |
|---|---|---|---|
| Open | Lo Lance | $466,650 |
Source: Public Records
Tax History Compared to Growth
Tax History
| Year | Tax Paid | Tax Assessment Tax Assessment Total Assessment is a certain percentage of the fair market value that is determined by local assessors to be the total taxable value of land and additions on the property. | Land | Improvement |
|---|---|---|---|---|
| 2025 | $4,392 | $320,825 | $162,856 | $157,969 |
| 2024 | $4,392 | $314,535 | $159,663 | $154,872 |
| 2023 | $4,315 | $308,369 | $156,533 | $151,836 |
| 2022 | $4,217 | $302,323 | $153,464 | $148,859 |
| 2021 | $4,136 | $296,396 | $150,455 | $145,941 |
| 2020 | $4,172 | $293,358 | $148,913 | $144,445 |
| 2019 | $4,032 | $287,607 | $145,994 | $141,613 |
| 2018 | $3,896 | $281,969 | $143,132 | $138,837 |
| 2017 | $3,551 | $276,441 | $140,326 | $136,115 |
| 2016 | $3,465 | $271,022 | $137,575 | $133,447 |
| 2015 | $3,419 | $266,952 | $135,509 | $131,443 |
| 2014 | $3,329 | $261,724 | $132,855 | $128,869 |
Source: Public Records
Map
Nearby Homes