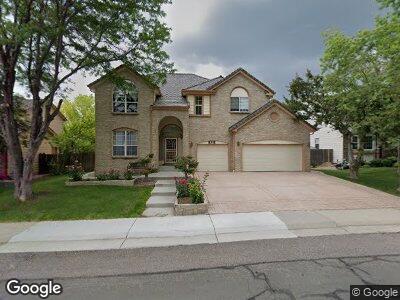
5712 S Estes Way Littleton, CO 80123
Governor's Ranch NeighborhoodEstimated Value: $855,000 - $990,000
4
Beds
5
Baths
2,991
Sq Ft
$300/Sq Ft
Est. Value
About This Home
This home is located at 5712 S Estes Way, Littleton, CO 80123 and is currently estimated at $896,173, approximately $299 per square foot. 5712 S Estes Way is a home located in Jefferson County with nearby schools including Governor's Ranch Elementary School, Ken Caryl Middle School, and Columbine High School.
Ownership History
Date
Name
Owned For
Owner Type
Purchase Details
Closed on
May 31, 2019
Sold by
Bui An Kim and Bui Quy T Kim
Bought by
Bui Tan Kim and Bui An Kim
Current Estimated Value
Purchase Details
Closed on
Mar 30, 2012
Sold by
Bui Mai and Dang Chau Thi
Bought by
Bui An Kim and Bui Quy T Kim
Purchase Details
Closed on
Feb 1, 2012
Sold by
Bui Mai and Dang Chau Thi
Bought by
Bui An K and Bui Quy K
Purchase Details
Closed on
Sep 18, 1998
Sold by
Mai Bui and Chau Dang Chau
Bought by
Bui Mai and Dang Chau Thi
Home Financials for this Owner
Home Financials are based on the most recent Mortgage that was taken out on this home.
Original Mortgage
$67,587
Interest Rate
6.92%
Purchase Details
Closed on
Nov 14, 1994
Sold by
Centex Real Estate Corp
Bought by
Bui An K and Bui Quy K
Home Financials for this Owner
Home Financials are based on the most recent Mortgage that was taken out on this home.
Original Mortgage
$105,000
Interest Rate
8.88%
Create a Home Valuation Report for This Property
The Home Valuation Report is an in-depth analysis detailing your home's value as well as a comparison with similar homes in the area
Home Values in the Area
Average Home Value in this Area
Purchase History
| Date | Buyer | Sale Price | Title Company |
|---|---|---|---|
| Bui Tan Kim | -- | None Available | |
| Bui An Kim | -- | None Available | |
| Bui An K | -- | None Available | |
| Bui Mai | -- | -- | |
| Bui An K | $255,888 | First American Heritage Titl |
Source: Public Records
Mortgage History
| Date | Status | Borrower | Loan Amount |
|---|---|---|---|
| Open | Bui Mai | $345,000 | |
| Closed | Bui Mai | $67,587 | |
| Previous Owner | Bui An K | $105,000 |
Source: Public Records
Tax History Compared to Growth
Tax History
| Year | Tax Paid | Tax Assessment Tax Assessment Total Assessment is a certain percentage of the fair market value that is determined by local assessors to be the total taxable value of land and additions on the property. | Land | Improvement |
|---|---|---|---|---|
| 2024 | $4,762 | $48,623 | $16,314 | $32,309 |
| 2023 | $4,762 | $48,623 | $16,314 | $32,309 |
| 2022 | $4,407 | $44,181 | $15,624 | $28,557 |
| 2021 | $4,464 | $45,452 | $16,073 | $29,379 |
| 2020 | $3,890 | $39,698 | $14,459 | $25,239 |
| 2019 | $3,841 | $39,698 | $14,459 | $25,239 |
| 2018 | $3,698 | $36,907 | $11,591 | $25,316 |
| 2017 | $3,375 | $36,907 | $11,591 | $25,316 |
| 2016 | $3,361 | $35,462 | $10,444 | $25,018 |
| 2015 | $3,416 | $35,462 | $10,444 | $25,018 |
| 2014 | $3,416 | $33,805 | $8,245 | $25,560 |
Source: Public Records
Map
Nearby Homes
- 5723 S Everett Way
- 5454 S Everett Ct
- 9684 W Long Dr
- 9379 W Burgundy Ave
- 9340 W Burgundy Ave
- 5426 S Independence St
- 5490 S Jellison St
- 6010 S Garland Way
- 9867 W Berry Dr
- 9565 W Lake Place
- 8705 W Berry Ave Unit 204
- 8615 W Berry Ave Unit 203
- 8615 W Berry Ave Unit 204
- 8775 W Berry Ave Unit 101
- 5455 S Dover St Unit 102
- 5455 S Dover St Unit 101
- 5960 S Jellison St Unit B
- 10102 W Ida Ave Unit 214
- 5976 S Jellison St Unit E
- 9135 W Maplewood Ave
- 5712 S Estes Way
- 5702 S Estes Way
- 5722 S Estes Way
- 5692 S Estes Way
- 5732 S Estes Way
- 8844 W Cross Place
- 8855 W Dorado Ct
- 5682 S Estes Way
- 8864 W Cross Place
- 5691 S Estes Way
- 8856 W Dorado Ct
- 5672 S Estes Way
- 8875 W Dorado Ct
- 5681 S Estes Way
- 8863 W Cross Place
- 8884 W Cross Place
- 8876 W Dorado Ct
- 8857 W Gould Way
- 8895 W Dorado Ct
- 8842 W Powers Place