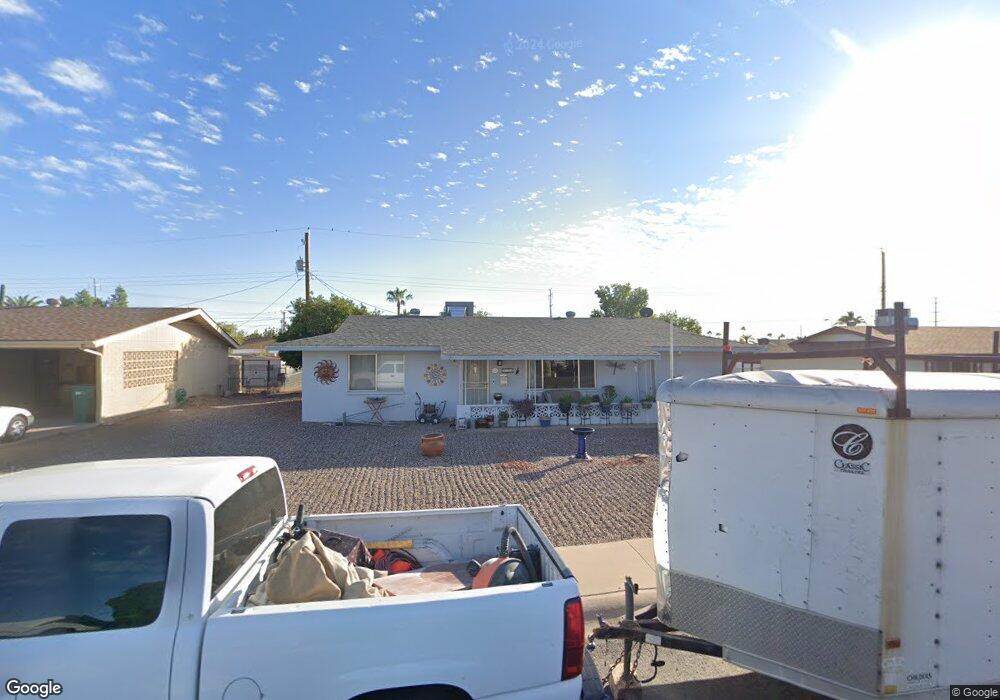
5725 E Casper Rd Mesa, AZ 85205
Central Mesa East NeighborhoodEstimated Value: $218,817 - $299,000
3
Beds
2
Baths
1,296
Sq Ft
$198/Sq Ft
Est. Value
About This Home
This home is located at 5725 E Casper Rd, Mesa, AZ 85205 and is currently estimated at $256,954, approximately $198 per square foot. 5725 E Casper Rd is a home located in Maricopa County with nearby schools including O'Connor Elementary School, Franklin at Brimhall Elementary School, and Franklin West Elementary School.
Ownership History
Date
Name
Owned For
Owner Type
Purchase Details
Closed on
Oct 1, 2021
Sold by
Matthews Mary Ellen Nye
Bought by
Matthews Mary Ellen Nye and Love Arthur J
Current Estimated Value
Purchase Details
Closed on
Sep 18, 2017
Sold by
Matthews Ii John R
Bought by
Matthews Ii John R and Matthews Mary Ellen Nye
Purchase Details
Closed on
May 1, 2008
Sold by
Shinneman Gleave Shannon
Bought by
Mattheww Ii John R and Matthews Michael
Home Financials for this Owner
Home Financials are based on the most recent Mortgage that was taken out on this home.
Original Mortgage
$137,837
Interest Rate
5.81%
Mortgage Type
FHA
Purchase Details
Closed on
Aug 14, 2007
Sold by
Shinneman Merlin D
Bought by
Shinneman Gleave Sharon and Merlin Dell Shinneman Living Trust
Purchase Details
Closed on
Sep 29, 1999
Sold by
Shinneman Beatrice J
Bought by
Shinneman Merlin D
Create a Home Valuation Report for This Property
The Home Valuation Report is an in-depth analysis detailing your home's value as well as a comparison with similar homes in the area
Home Values in the Area
Average Home Value in this Area
Purchase History
| Date | Buyer | Sale Price | Title Company |
|---|---|---|---|
| Matthews Mary Ellen Nye | -- | None Listed On Document | |
| Matthews Ii John R | -- | None Available | |
| Mattheww Ii John R | $140,000 | Fidelity National Title Ins | |
| Shinneman Gleave Sharon | -- | None Available | |
| Shinneman Merlin D | -- | Transnation Title Ins Co | |
| Shinneman Merlin D | $73,000 | Transnation Title Ins Co |
Source: Public Records
Mortgage History
| Date | Status | Borrower | Loan Amount |
|---|---|---|---|
| Previous Owner | Mattheww Ii John R | $137,837 |
Source: Public Records
Tax History
| Year | Tax Paid | Tax Assessment Tax Assessment Total Assessment is a certain percentage of the fair market value that is determined by local assessors to be the total taxable value of land and additions on the property. | Land | Improvement |
|---|---|---|---|---|
| 2025 | $719 | $8,842 | -- | -- |
| 2024 | $729 | $8,421 | -- | -- |
| 2023 | $729 | $19,110 | $3,820 | $15,290 |
| 2022 | $712 | $14,570 | $2,910 | $11,660 |
| 2021 | $720 | $12,610 | $2,520 | $10,090 |
| 2020 | $713 | $11,380 | $2,270 | $9,110 |
| 2019 | $663 | $10,420 | $2,080 | $8,340 |
| 2018 | $640 | $9,280 | $1,850 | $7,430 |
| 2017 | $629 | $8,070 | $1,610 | $6,460 |
| 2016 | $610 | $7,500 | $1,500 | $6,000 |
| 2015 | $575 | $7,050 | $1,410 | $5,640 |
Source: Public Records
Map
Nearby Homes
- 5714 E Covina Rd
- 5627 E Covina Rd
- 5832 Colby St
- 639 N 57th Place
- 5856 Colby St
- 5901 E Casper Rd
- 440 N 56th St
- 5533 E Decatur St
- 5519 E Casper Rd
- 5832 E Billings St
- 5704 E Dodge St
- 5851 E Dodge St
- 5634 E Dodge St
- 708 N 56th St
- 5939 E Butte St
- 5644 E Duncan St
- 5822 E Duncan St
- 5903 E Duncan St
- 5915 E Duncan St
- 5502 E Butte St
- 5731 E Casper Rd
- 5719 E Casper Rd
- 5726 E Covina Rd
- 5720 E Covina Rd
- 5726 E Casper Rd
- 5737 E Casper Rd
- 5713 E Casper Rd
- 5720 E Casper Rd
- 5732 E Casper Rd
- 5738 E Covina Rd
- 5714 E Casper Rd
- 5738 E Casper Rd
- 5707 E Casper Rd
- 5743 E Casper Rd
- 5708 E Covina Rd
- 5725 E Colby Rd Unit 2
- 5725 E Covina Rd
- 5740 E Covina Rd
- 5731 E Covina Rd
- 5731 E Colby Rd
Your Personal Tour Guide
Ask me questions while you tour the home.