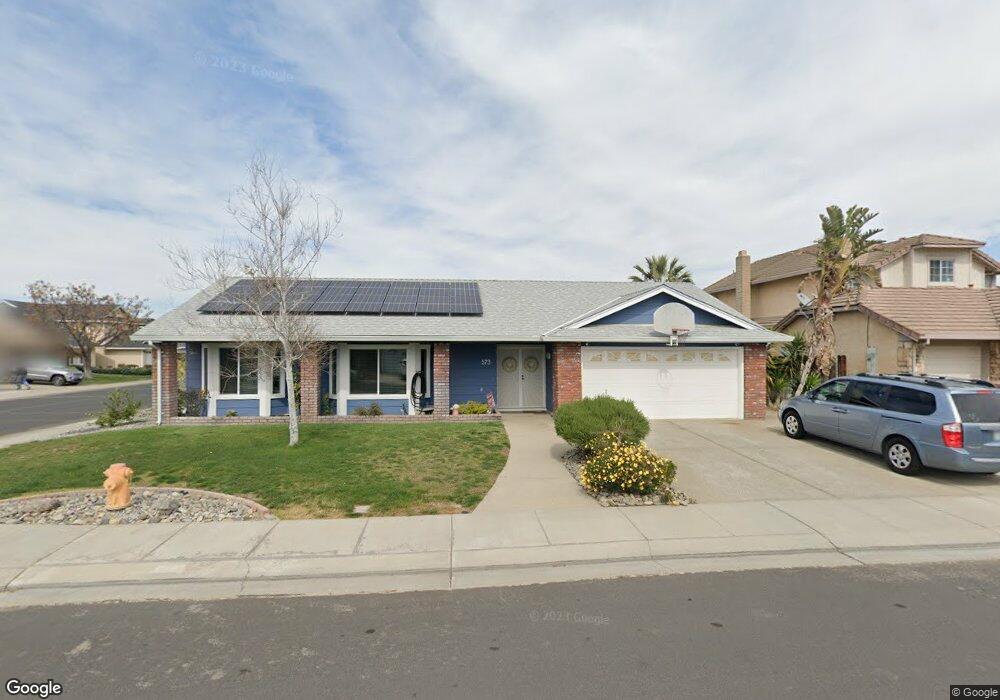
573 Carrigane Way Manteca, CA 95337
Downtown Manteca NeighborhoodEstimated Value: $467,000 - $600,000
4
Beds
2
Baths
2,061
Sq Ft
$274/Sq Ft
Est. Value
About This Home
This home is located at 573 Carrigane Way, Manteca, CA 95337 and is currently estimated at $564,247, approximately $273 per square foot. 573 Carrigane Way is a home located in San Joaquin County with nearby schools including Sequoia Elementary School and Manteca High School.
Ownership History
Date
Name
Owned For
Owner Type
Purchase Details
Closed on
Jul 1, 2021
Sold by
Grubb Adam
Bought by
Grubb Adam and Grubb Sharon
Current Estimated Value
Home Financials for this Owner
Home Financials are based on the most recent Mortgage that was taken out on this home.
Original Mortgage
$325,000
Outstanding Balance
$295,336
Interest Rate
3%
Mortgage Type
New Conventional
Estimated Equity
$268,911
Purchase Details
Closed on
Feb 28, 2007
Sold by
Yasonia Murphy Nicholas G
Bought by
Grubb Adam
Home Financials for this Owner
Home Financials are based on the most recent Mortgage that was taken out on this home.
Original Mortgage
$387,000
Interest Rate
7.25%
Mortgage Type
Purchase Money Mortgage
Purchase Details
Closed on
Feb 12, 2007
Sold by
Grubb Sharon S
Bought by
Grubb Adam
Home Financials for this Owner
Home Financials are based on the most recent Mortgage that was taken out on this home.
Original Mortgage
$387,000
Interest Rate
7.25%
Mortgage Type
Purchase Money Mortgage
Purchase Details
Closed on
Jan 23, 2007
Sold by
Dickson Rose
Bought by
Yasonia Murphy Nicholas G
Home Financials for this Owner
Home Financials are based on the most recent Mortgage that was taken out on this home.
Original Mortgage
$387,000
Interest Rate
7.25%
Mortgage Type
Purchase Money Mortgage
Purchase Details
Closed on
Jan 12, 2007
Sold by
Yasonia Murphy Nicholas G
Bought by
Murphy Nicholas G Yasonia
Home Financials for this Owner
Home Financials are based on the most recent Mortgage that was taken out on this home.
Original Mortgage
$387,000
Interest Rate
7.25%
Mortgage Type
Purchase Money Mortgage
Purchase Details
Closed on
Feb 15, 2005
Sold by
Striegold Michael
Bought by
Yasonia Murphy Nicholas G
Home Financials for this Owner
Home Financials are based on the most recent Mortgage that was taken out on this home.
Original Mortgage
$328,500
Interest Rate
6.8%
Mortgage Type
Purchase Money Mortgage
Purchase Details
Closed on
Dec 5, 2002
Sold by
Wyman Daniel K and Wyman Timi L
Bought by
Striegold Michael
Home Financials for this Owner
Home Financials are based on the most recent Mortgage that was taken out on this home.
Original Mortgage
$228,800
Interest Rate
6.55%
Purchase Details
Closed on
Jul 11, 2000
Sold by
Laughton Dennis J and Laughton Lynn M
Bought by
Wyman Daniel K and Wyman Timi L
Home Financials for this Owner
Home Financials are based on the most recent Mortgage that was taken out on this home.
Original Mortgage
$187,900
Interest Rate
8.12%
Create a Home Valuation Report for This Property
The Home Valuation Report is an in-depth analysis detailing your home's value as well as a comparison with similar homes in the area
Home Values in the Area
Average Home Value in this Area
Purchase History
| Date | Buyer | Sale Price | Title Company |
|---|---|---|---|
| Grubb Adam | -- | Boston National Title | |
| Grubb Adam | $430,000 | Old Republic Title Company | |
| Grubb Adam | -- | Old Republic Title Company | |
| Yasonia Murphy Nicholas G | -- | Alliance Title Company | |
| Murphy Nicholas G Yasonia | -- | Alliance Title Company | |
| Yasonia Murphy Nicholas G | $286,000 | Fidelity Natl Title Ins Co | |
| Striegold Michael | $286,000 | First Amer Title Co | |
| Wyman Daniel K | $235,000 | First American Title Co |
Source: Public Records
Mortgage History
| Date | Status | Borrower | Loan Amount |
|---|---|---|---|
| Open | Grubb Adam | $325,000 | |
| Closed | Grubb Adam | $387,000 | |
| Closed | Yasonia Murphy Nicholas G | $392,000 | |
| Previous Owner | Murphy Nicholas G Yasonia | $392,000 | |
| Previous Owner | Yasonia Murphy Nicholas G | $328,500 | |
| Previous Owner | Striegold Michael | $228,800 | |
| Previous Owner | Wyman Daniel K | $187,900 | |
| Closed | Wyman Daniel K | $23,450 | |
| Closed | Striegold Michael | $57,200 |
Source: Public Records
Tax History
| Year | Tax Paid | Tax Assessment Tax Assessment Total Assessment is a certain percentage of the fair market value that is determined by local assessors to be the total taxable value of land and additions on the property. | Land | Improvement |
|---|---|---|---|---|
| 2025 | $6,335 | $576,079 | $230,430 | $345,649 |
| 2024 | $6,156 | $564,784 | $225,912 | $338,872 |
| 2023 | $6,080 | $553,711 | $221,483 | $332,228 |
| 2022 | $5,988 | $542,855 | $217,141 | $325,714 |
| 2021 | $5,520 | $496,500 | $120,000 | $376,500 |
| 2020 | $4,751 | $441,500 | $120,000 | $321,500 |
| 2019 | $4,783 | $441,500 | $120,000 | $321,500 |
| 2018 | $4,510 | $414,000 | $120,000 | $294,000 |
| 2017 | $4,300 | $393,000 | $157,000 | $236,000 |
| 2016 | $3,838 | $353,000 | $141,000 | $212,000 |
| 2014 | $3,130 | $300,000 | $120,000 | $180,000 |
Source: Public Records
Map
Nearby Homes
- 707 Chenin Blanc Dr
- 628 Mission Ridge Dr
- 776 Folsom Way
- 778 Mission Ridge Dr
- 865 Locust Ave
- 123 Wawona St
- 938 Snowgoose Ln
- 896 Cinnamon Teal Ct
- 315 Lupton St
- 475 Quintal Rd
- 1015 Tenaya Ct
- 1025 Barbados St
- 555 555 Moffat Blvd Unit 33
- 2299 Bharvani Ave
- 396 Postma St
- 1164 Marion St
- 119 Almond Ave
- 317 Moffat Blvd Unit 21
- 317 Moffat Blvd Unit 14
- 317 Moffat Blvd Unit 6
- 547 Carrigane Way
- 570 Reisling Ct
- 558 Reisling Ct
- 531 Carrigane Way
- 1159 Cabernet Ln
- 1151 Cabernet Ln
- 588 Carrigane Way
- 546 Reisling Ct
- 562 Carrigane Way
- 610 Carrigane Way
- 1139 Cabernet Ln
- 540 Carrigane Way
- 634 Carrigane Way
- 534 Reisling Ct
- 515 Carrigane Way
- 1131 Cabernet Ln
- 1158 Chianti Ln
- 1150 Chianti Ln
- 516 Carrigane Way
- 1142 Chianti Ln
Your Personal Tour Guide
Ask me questions while you tour the home.