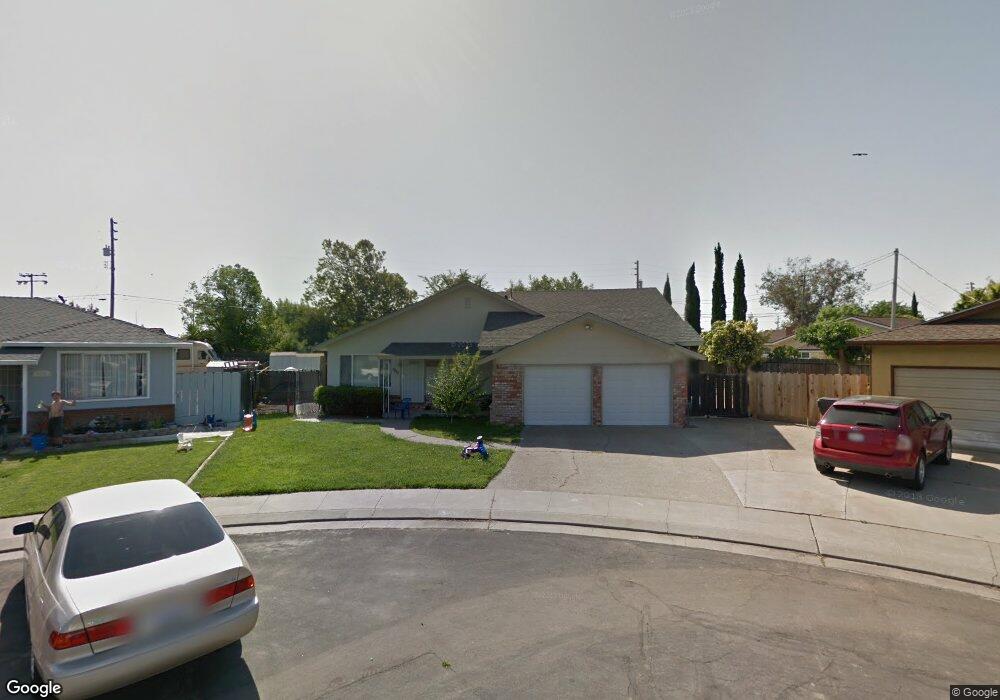
5737 Navajo Ct Manteca, CA 95336
Estimated Value: $97,000 - $502,000
3
Beds
2
Baths
1,552
Sq Ft
$249/Sq Ft
Est. Value
About This Home
This home is located at 5737 Navajo Ct, Manteca, CA 95336 and is currently estimated at $386,058, approximately $248 per square foot. 5737 Navajo Ct is a home located in San Joaquin County with nearby schools including New Haven Elementary School and East Union High School.
Ownership History
Date
Name
Owned For
Owner Type
Purchase Details
Closed on
Apr 16, 2018
Sold by
Hansen David D and Hansen Patricia P
Bought by
Hansen Patricia P and Navajo Court Trust
Current Estimated Value
Purchase Details
Closed on
Jul 19, 2011
Sold by
Federal Home Loan Mortgage Corporation
Bought by
Hansen David D and Hansen Patricia P
Purchase Details
Closed on
Oct 7, 2010
Sold by
Jordan Randy and Jordan Tracy A
Bought by
Federal Home Loan Mortgage Corporation
Purchase Details
Closed on
Jul 29, 1997
Sold by
Anne Hecht J and Anne Jo
Bought by
Jordan Randy and Jordan Tracy A
Home Financials for this Owner
Home Financials are based on the most recent Mortgage that was taken out on this home.
Original Mortgage
$103,681
Interest Rate
7.58%
Mortgage Type
FHA
Purchase Details
Closed on
Sep 18, 1995
Sold by
Hecht David and Hecht Joanne
Bought by
Hecht Jo Anne
Create a Home Valuation Report for This Property
The Home Valuation Report is an in-depth analysis detailing your home's value as well as a comparison with similar homes in the area
Home Values in the Area
Average Home Value in this Area
Purchase History
| Date | Buyer | Sale Price | Title Company |
|---|---|---|---|
| Hansen Patricia P | -- | None Available | |
| Hansen David D | $93,000 | Lsi Title Company | |
| Federal Home Loan Mortgage Corporation | $118,072 | Accommodation | |
| Jordan Randy | $104,500 | North American Title Co | |
| Hecht Jo Anne | -- | -- |
Source: Public Records
Mortgage History
| Date | Status | Borrower | Loan Amount |
|---|---|---|---|
| Previous Owner | Jordan Randy | $103,681 |
Source: Public Records
Tax History Compared to Growth
Tax History
| Year | Tax Paid | Tax Assessment Tax Assessment Total Assessment is a certain percentage of the fair market value that is determined by local assessors to be the total taxable value of land and additions on the property. | Land | Improvement |
|---|---|---|---|---|
| 2025 | $2,874 | $116,804 | $28,884 | $87,920 |
| 2024 | $2,826 | $114,515 | $28,318 | $86,197 |
| 2023 | $2,777 | $112,270 | $27,763 | $84,507 |
| 2022 | $2,758 | $110,069 | $27,219 | $82,850 |
| 2021 | $2,742 | $107,912 | $26,686 | $81,226 |
| 2020 | $2,692 | $106,807 | $26,413 | $80,394 |
| 2019 | $2,677 | $104,714 | $25,896 | $78,818 |
| 2018 | $2,626 | $102,662 | $25,389 | $77,273 |
| 2017 | $2,609 | $100,650 | $24,892 | $75,758 |
| 2016 | $2,560 | $98,676 | $24,404 | $74,272 |
| 2014 | $2,406 | $95,290 | $23,566 | $71,724 |
Source: Public Records
Map
Nearby Homes
- 14665 Cree Ct
- 6288 E Lathrop Rd
- 2021 Holbrook Place
- 1870 Pecanwood Ave
- 1340 Crimson Place
- 2016 Westboro Ln
- 439 Ericwood Ct
- 447 Ericwood Ct
- 1624 S Frontage Rd Unit 21
- 889 Harvest Mill Dr
- 1660 Kingwood Ave
- 2418 Finchwood Landing Ln
- 1624 S Highway 99 Unit 19
- 13120 S Frontage Rd
- 1460 Primitivo Ln
- 1385 Crestwood Ave
- 1072 Glen Abbey Dr
- 484 Pinehurst St
- 7001 Southland Rd
- 1052 Camborne Dr
- 5743 Navajo Ct
- 5744 Navajo Ct
- 5696 Apache Dr
- 5716 Apache Dr
- 14570 S Frontage Rd
- 14660 S Frontage Rd
- 5752 Navajo Ct
- 14637 Navajo Way
- 14592 Navajo Way
- 14614 Navajo Way
- 5746 Apache Dr
- 14660 S State Route 99 E Fron Rd
- 14636 Navajo Way
- 1645 California 99 Unit 61
- 5697 Apache Dr
- 5657 Apache Dr
- 14422 S Frontage Rd
- 14680 S Highway 99
- 14579 Pueblo Dr
- 14646 Navajo Way