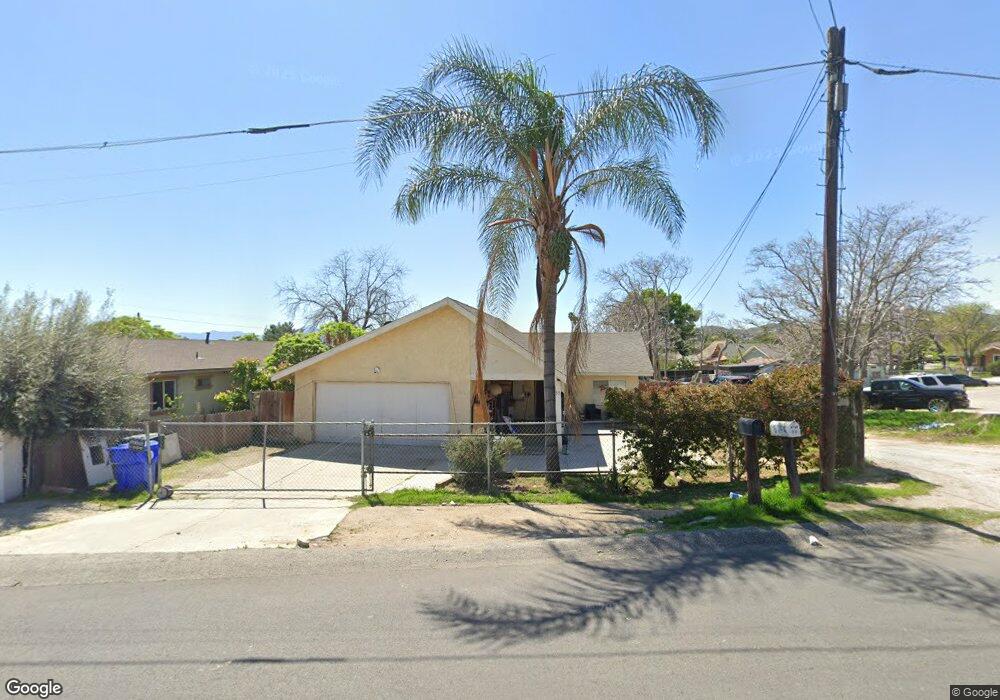
5746 36th St Riverside, CA 92509
Rubidoux NeighborhoodEstimated Value: $359,000 - $473,000
2
Beds
2
Baths
832
Sq Ft
$518/Sq Ft
Est. Value
About This Home
This home is located at 5746 36th St, Riverside, CA 92509 and is currently estimated at $430,658, approximately $517 per square foot. 5746 36th St is a home located in Riverside County with nearby schools including West Riverside Elementary, Mission Middle School, and Rubidoux High School.
Ownership History
Date
Name
Owned For
Owner Type
Purchase Details
Closed on
Jul 2, 2013
Sold by
Perales Abe
Bought by
Garcia Jovita
Current Estimated Value
Purchase Details
Closed on
Nov 8, 2000
Sold by
Hart Janice L
Bought by
Hart Bobby
Home Financials for this Owner
Home Financials are based on the most recent Mortgage that was taken out on this home.
Original Mortgage
$80,510
Interest Rate
7.66%
Mortgage Type
Purchase Money Mortgage
Purchase Details
Closed on
Oct 20, 2000
Sold by
Hart Bobby
Bought by
Perales Abe and Garcia Jovita
Home Financials for this Owner
Home Financials are based on the most recent Mortgage that was taken out on this home.
Original Mortgage
$80,510
Interest Rate
7.66%
Mortgage Type
Purchase Money Mortgage
Purchase Details
Closed on
Apr 10, 2000
Sold by
Pomona First Fsla
Bought by
Hart Bobby
Create a Home Valuation Report for This Property
The Home Valuation Report is an in-depth analysis detailing your home's value as well as a comparison with similar homes in the area
Home Values in the Area
Average Home Value in this Area
Purchase History
| Date | Buyer | Sale Price | Title Company |
|---|---|---|---|
| Garcia Jovita | -- | None Available | |
| Hart Bobby | -- | Chicago Title Co | |
| Perales Abe | $83,000 | Chicago Title Co | |
| Hart Bobby | $24,750 | Chicago Title Co | |
| Hart Bobby | -- | Chicago Title Co |
Source: Public Records
Mortgage History
| Date | Status | Borrower | Loan Amount |
|---|---|---|---|
| Previous Owner | Perales Abe | $80,510 |
Source: Public Records
Tax History
| Year | Tax Paid | Tax Assessment Tax Assessment Total Assessment is a certain percentage of the fair market value that is determined by local assessors to be the total taxable value of land and additions on the property. | Land | Improvement |
|---|---|---|---|---|
| 2025 | $1,670 | $154,451 | $57,006 | $97,445 |
| 2023 | $1,670 | $148,456 | $54,794 | $93,662 |
| 2022 | $2,832 | $145,546 | $53,720 | $91,826 |
| 2021 | $2,824 | $142,693 | $52,667 | $90,026 |
| 2020 | $2,762 | $141,230 | $52,127 | $89,103 |
| 2019 | $2,729 | $138,461 | $51,105 | $87,356 |
| 2018 | $2,673 | $135,747 | $50,103 | $85,644 |
| 2017 | $2,651 | $133,086 | $49,121 | $83,965 |
| 2016 | $2,692 | $130,477 | $48,158 | $82,319 |
| 2015 | $2,681 | $128,520 | $47,436 | $81,084 |
| 2014 | $2,580 | $126,004 | $46,507 | $79,497 |
Source: Public Records
Map
Nearby Homes
- 3634 Pioneer Dr
- 0 Mission Blvd Unit IG25268475
- 0 Mission Blvd Unit PW25275749
- 0 Mission Blvd Unit IV23139894
- 5803 Mission Blvd
- 3319 Avalon St Unit 78
- 3319 Avalon St Unit 22
- 3319 Avalon St Unit 39
- 3319 Avalon St
- 3319 Avalon St Unit 33
- 3350 Jennie St
- 3934 Pontiac Ave
- 3747 Mintern St
- 3895 Twining St
- 7620 La Canada Dr
- 7525 La Canada Dr
- 7632 La Canada Dr
- 5479 34th St
- 5754 Tilton Ave
- 5748 Tilton Ave
Your Personal Tour Guide
Ask me questions while you tour the home.