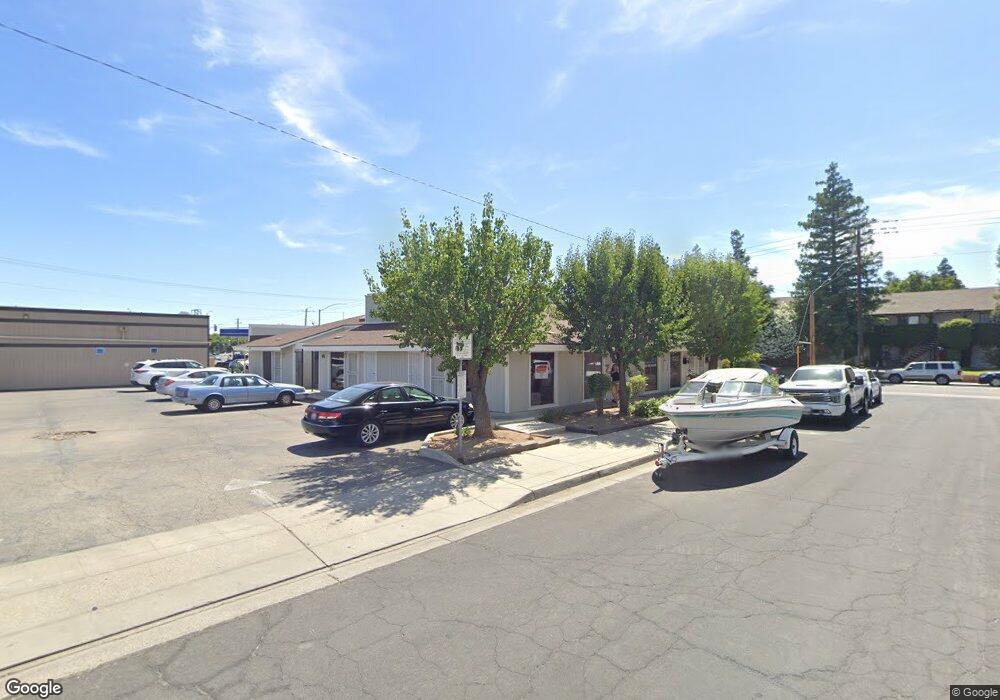
575 Minnewawa Ave Clovis, CA 93612
Studio
--
Bath
4,323
Sq Ft
14,375
Sq Ft Lot
About This Home
This home is located at 575 Minnewawa Ave, Clovis, CA 93612. 575 Minnewawa Ave is a home located in Fresno County with nearby schools including Weldon Elementary School, Clark Intermediate School, and Clovis High School.
Ownership History
Date
Name
Owned For
Owner Type
Purchase Details
Closed on
Nov 27, 2023
Sold by
Culcasi Kathleen
Bought by
Vincent And Kathleen Culcasi Family Trust and Culcasi
Purchase Details
Closed on
Nov 7, 2019
Sold by
Culcasi Vincent P
Bought by
Culcasi Kathleen M
Home Financials for this Owner
Home Financials are based on the most recent Mortgage that was taken out on this home.
Original Mortgage
$150,000
Interest Rate
3.5%
Mortgage Type
Commercial
Purchase Details
Closed on
Apr 22, 2019
Sold by
Grace A Lucido Living Trust
Bought by
Culcasi Kathleen M
Purchase Details
Closed on
Feb 3, 2014
Sold by
Lucido Samuel A and Lucido Linda A
Bought by
Lucido Grace A
Purchase Details
Closed on
Dec 5, 2006
Sold by
Lucido Samuel A and Lucido Linda A
Bought by
Lucido Samuel A and Lucido Linda A
Purchase Details
Closed on
Mar 21, 2006
Sold by
Lucido Grace A
Bought by
Culcasi Vincent P and Culcasi Kathleen M
Create a Home Valuation Report for This Property
The Home Valuation Report is an in-depth analysis detailing your home's value as well as a comparison with similar homes in the area
Home Values in the Area
Average Home Value in this Area
Purchase History
| Date | Buyer | Sale Price | Title Company |
|---|---|---|---|
| Vincent And Kathleen Culcasi Family Trust | -- | None Listed On Document | |
| Culcasi Kathleen M | -- | Stewart Title Of Ca Inc | |
| Culcasi Kathleen M | -- | Chicago Title Company | |
| Lucido Grace A | -- | None Available | |
| Lucido Samuel A | -- | None Available | |
| Culcasi Vincent P | -- | None Available | |
| Lucido Grace A | -- | None Available |
Source: Public Records
Mortgage History
| Date | Status | Borrower | Loan Amount |
|---|---|---|---|
| Previous Owner | Culcasi Kathleen M | $150,000 |
Source: Public Records
Tax History
| Year | Tax Paid | Tax Assessment Tax Assessment Total Assessment is a certain percentage of the fair market value that is determined by local assessors to be the total taxable value of land and additions on the property. | Land | Improvement |
|---|---|---|---|---|
| 2025 | $4,720 | $387,824 | $95,690 | $292,134 |
| 2023 | $4,649 | $374,033 | $91,975 | $282,058 |
| 2022 | $4,506 | $367,000 | $90,172 | $276,828 |
| 2021 | $4,379 | $359,404 | $88,404 | $271,000 |
| 2020 | $4,382 | $357,369 | $87,498 | $269,871 |
| 2019 | $4,191 | $341,179 | $85,783 | $255,396 |
| 2018 | $4,026 | $328,019 | $84,101 | $243,918 |
| 2017 | $3,960 | $321,588 | $82,452 | $239,136 |
| 2016 | $3,831 | $315,284 | $80,836 | $234,448 |
| 2015 | $3,774 | $310,549 | $79,622 | $230,927 |
| 2014 | $3,707 | $304,467 | $78,063 | $226,404 |
Source: Public Records
Map
Nearby Homes
- 142 9th St
- 103 Poppy Ln
- 1234 No Address Available
- 474 W Windsor Ave
- 125 N Pollasky Ave
- 1001 Sylmar Ave Unit 131
- 1001 Sylmar Ave Unit 99
- 1001 Sylmar Ave Unit 126
- 1001 Sylmar Ave Unit 155
- 1001 Sylmar Ave
- 345 Sylmar Ave
- 1465 Mayflower Way
- 69 W Beverly Ave Unit 101
- 1416 Plymouth Rock Way
- 1272 Villa Ave Unit 69
- 1272 Villa Ave Unit 76
- 1272 Villa Ave Unit SPC92
- 1448 Plymouth Rock Way
- 1468 Plymouth Rock Way
- 595 Quill Ln
- 491 Minnewawa Ave Unit 101
- 75 Bullard Ave
- 105 Bullard Ave
- 481 Minnewawa Ave Unit 104
- 119 5th St
- 117 Bullard Ave
- 124 5th St
- 461 Minnewawa Ave Unit 103
- 461 Minnewawa Ave Unit 101
- 127 5th St
- 0 Bullard Ave
- 448 Cherry Ln
- 136 5th St
- 135 5th St
- 445 Cherry Ln
- 142 5th St
- 0 Shaw (4 Lots) Ave Unit 494041
- 0 4th St
- 147 5th St
- 145 5th St
Your Personal Tour Guide
Ask me questions while you tour the home.