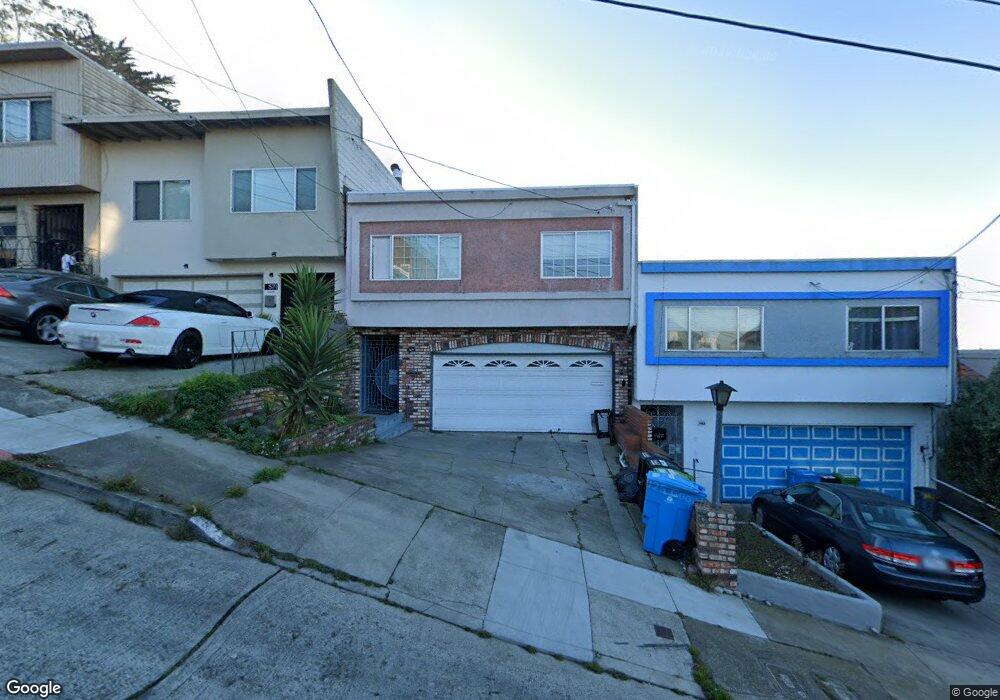
575 Orizaba Ave San Francisco, CA 94132
Merced Heights NeighborhoodEstimated Value: $1,110,000 - $1,502,000
4
Beds
2
Baths
1,605
Sq Ft
$780/Sq Ft
Est. Value
About This Home
This home is located at 575 Orizaba Ave, San Francisco, CA 94132 and is currently estimated at $1,252,289, approximately $780 per square foot. 575 Orizaba Ave is a home located in San Francisco County with nearby schools including Ortega (Jose) Elementary School, Aptos Middle School, and Leadership High School.
Ownership History
Date
Name
Owned For
Owner Type
Purchase Details
Closed on
Sep 8, 2015
Sold by
Okorie Alphonsus
Bought by
Okorie Alphonsus Nnanna and Okorie Theresa Ekpereamaka
Current Estimated Value
Purchase Details
Closed on
Jul 19, 1999
Sold by
Motoshige Neal M
Bought by
Okorie Alphonsus
Home Financials for this Owner
Home Financials are based on the most recent Mortgage that was taken out on this home.
Original Mortgage
$232,800
Outstanding Balance
$64,952
Interest Rate
7.51%
Mortgage Type
Stand Alone First
Estimated Equity
$1,187,337
Purchase Details
Closed on
Jul 16, 1999
Sold by
Okorie Theresa E
Bought by
Okorie Alphonsus
Home Financials for this Owner
Home Financials are based on the most recent Mortgage that was taken out on this home.
Original Mortgage
$232,800
Outstanding Balance
$64,952
Interest Rate
7.51%
Mortgage Type
Stand Alone First
Estimated Equity
$1,187,337
Create a Home Valuation Report for This Property
The Home Valuation Report is an in-depth analysis detailing your home's value as well as a comparison with similar homes in the area
Home Values in the Area
Average Home Value in this Area
Purchase History
| Date | Buyer | Sale Price | Title Company |
|---|---|---|---|
| Okorie Alphonsus Nnanna | -- | None Available | |
| Okorie Alphonsus | $291,000 | First American Title Co | |
| Okorie Alphonsus | -- | -- |
Source: Public Records
Mortgage History
| Date | Status | Borrower | Loan Amount |
|---|---|---|---|
| Open | Okorie Alphonsus | $232,800 | |
| Closed | Okorie Alphonsus | $29,100 |
Source: Public Records
Tax History Compared to Growth
Tax History
| Year | Tax Paid | Tax Assessment Tax Assessment Total Assessment is a certain percentage of the fair market value that is determined by local assessors to be the total taxable value of land and additions on the property. | Land | Improvement |
|---|---|---|---|---|
| 2025 | $6,095 | $461,950 | $230,516 | $231,434 |
| 2024 | $6,095 | $452,896 | $225,998 | $226,898 |
| 2023 | $5,995 | $444,020 | $221,568 | $222,452 |
| 2022 | $5,868 | $435,316 | $217,224 | $218,092 |
| 2021 | $5,760 | $426,784 | $212,966 | $213,818 |
| 2020 | $5,853 | $422,412 | $210,784 | $211,628 |
| 2019 | $5,658 | $414,132 | $206,652 | $207,480 |
| 2018 | $5,465 | $406,014 | $202,600 | $203,414 |
| 2017 | $5,103 | $398,054 | $198,628 | $199,426 |
| 2016 | $4,994 | $390,277 | $194,745 | $195,532 |
| 2015 | $4,928 | $384,416 | $191,820 | $192,596 |
| 2014 | $4,800 | $376,887 | $188,063 | $188,824 |
Source: Public Records
Map
Nearby Homes