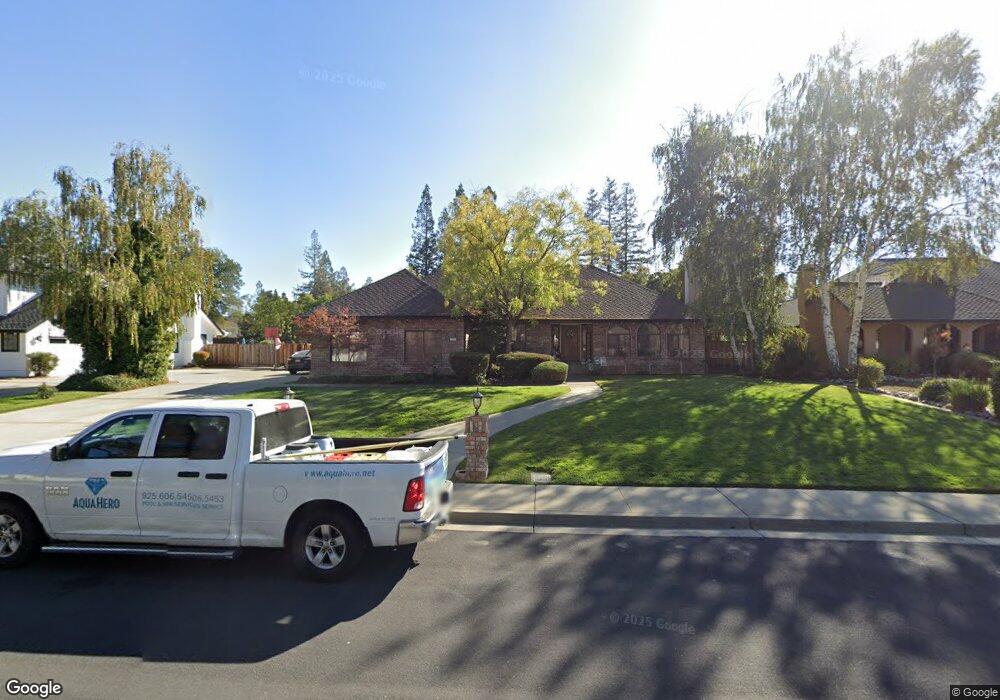
575 Rhea Way Livermore, CA 94550
Estimated Value: $2,054,000 - $2,223,000
4
Beds
3
Baths
3,124
Sq Ft
$682/Sq Ft
Est. Value
About This Home
This home is located at 575 Rhea Way, Livermore, CA 94550 and is currently estimated at $2,131,000, approximately $682 per square foot. 575 Rhea Way is a home located in Alameda County with nearby schools including Emma C. Smith Elementary School, William Mendenhall Middle School, and Granada High School.
Ownership History
Date
Name
Owned For
Owner Type
Purchase Details
Closed on
Nov 23, 2005
Sold by
Franco Gregory C and Franco Carla M
Bought by
Franco Gregory C and Franco Carla M
Current Estimated Value
Home Financials for this Owner
Home Financials are based on the most recent Mortgage that was taken out on this home.
Original Mortgage
$825,500
Outstanding Balance
$658,679
Interest Rate
6.79%
Mortgage Type
Purchase Money Mortgage
Estimated Equity
$1,472,321
Purchase Details
Closed on
Apr 2, 2004
Sold by
Brewer Frank E and Brewer Yvonne J
Bought by
Franco Gregory and Gaudiano Carla
Home Financials for this Owner
Home Financials are based on the most recent Mortgage that was taken out on this home.
Original Mortgage
$650,000
Interest Rate
4.87%
Mortgage Type
Purchase Money Mortgage
Purchase Details
Closed on
May 9, 2000
Sold by
Daves Robert W and Daves Sarah L
Bought by
Brewer Frank E and Brewer Yvonne J
Home Financials for this Owner
Home Financials are based on the most recent Mortgage that was taken out on this home.
Original Mortgage
$639,950
Interest Rate
8.26%
Create a Home Valuation Report for This Property
The Home Valuation Report is an in-depth analysis detailing your home's value as well as a comparison with similar homes in the area
Purchase History
| Date | Buyer | Sale Price | Title Company |
|---|---|---|---|
| Franco Gregory C | -- | United Title Company | |
| Franco Gregory | $950,000 | Chicago Title Company | |
| Brewer Frank E | $800,000 | North American Title Co |
Source: Public Records
Mortgage History
| Date | Status | Borrower | Loan Amount |
|---|---|---|---|
| Open | Franco Gregory C | $825,500 | |
| Closed | Franco Gregory | $650,000 | |
| Previous Owner | Brewer Frank E | $639,950 | |
| Closed | Franco Gregory | $109,950 |
Source: Public Records
Tax History
| Year | Tax Paid | Tax Assessment Tax Assessment Total Assessment is a certain percentage of the fair market value that is determined by local assessors to be the total taxable value of land and additions on the property. | Land | Improvement |
|---|---|---|---|---|
| 2025 | $16,095 | $1,343,624 | $405,187 | $945,437 |
| 2024 | $16,095 | $1,317,147 | $397,244 | $926,903 |
| 2023 | $15,882 | $1,298,184 | $389,455 | $908,729 |
| 2022 | $15,679 | $1,265,733 | $381,820 | $890,913 |
| 2021 | $15,380 | $1,240,786 | $374,336 | $873,450 |
| 2020 | $14,955 | $1,235,000 | $370,500 | $864,500 |
| 2019 | $15,039 | $1,210,784 | $363,235 | $847,549 |
| 2018 | $14,745 | $1,187,043 | $356,113 | $830,930 |
| 2017 | $14,388 | $1,163,768 | $349,130 | $814,638 |
| 2016 | $13,891 | $1,140,950 | $342,285 | $798,665 |
| 2015 | $13,019 | $1,123,811 | $337,143 | $786,668 |
| 2014 | $12,240 | $1,051,000 | $315,300 | $735,700 |
Source: Public Records
Map
Nearby Homes
- 575 Bell Ave
- 2124 Orion Ct
- 628 Lido Dr
- 631 Alden Ln
- 733 Mayview Way
- 555 Ontario Dr
- 469 Ontario Dr
- 1548 Klondike Place
- 1556 Wagoner Dr
- 2425 French Oak Place
- 2459 French Oak Place
- 1059 Catalina Dr
- 255 Prato Way
- 637 Caliente Ave
- 1349 Evans Place
- 1185 El Dorado Dr
- 1174 Carrara Ct
- 1835 Cairo St
- 381 Ann Ct
- 563 Cinnabar Dr
Your Personal Tour Guide
Ask me questions while you tour the home.