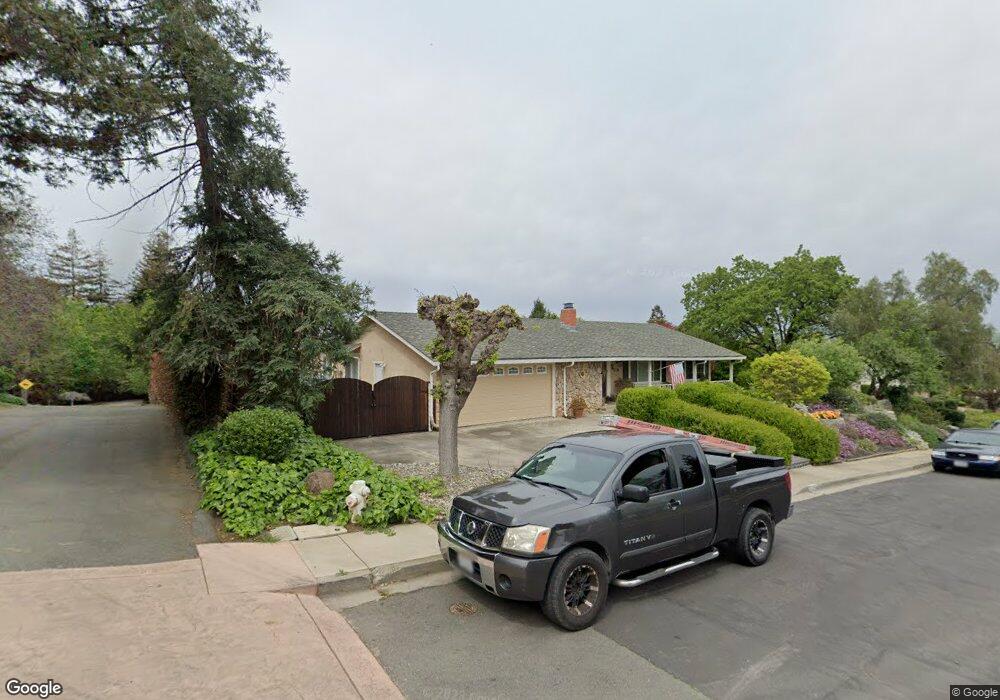
5750 Tamarack Way Concord, CA 94521
The Highlands NeighborhoodEstimated Value: $999,966 - $1,256,000
4
Beds
2
Baths
2,083
Sq Ft
$520/Sq Ft
Est. Value
About This Home
This home is located at 5750 Tamarack Way, Concord, CA 94521 and is currently estimated at $1,083,742, approximately $520 per square foot. 5750 Tamarack Way is a home located in Contra Costa County with nearby schools including Mt. Diablo Elementary School, Diablo View Middle School, and College Park High School.
Ownership History
Date
Name
Owned For
Owner Type
Purchase Details
Closed on
Oct 16, 2024
Sold by
Thompson Beaux Alegri and Thompson Jirina Vesley
Bought by
Thompson 2024 Revocable Trust and Thompson
Current Estimated Value
Purchase Details
Closed on
Nov 30, 2015
Sold by
Suh John Han and Shu Kab Hee
Bought by
Thompson Beaux Alegri and Thompson Jirina Vesely
Home Financials for this Owner
Home Financials are based on the most recent Mortgage that was taken out on this home.
Original Mortgage
$557,600
Interest Rate
3.73%
Mortgage Type
New Conventional
Purchase Details
Closed on
Feb 19, 2008
Sold by
Suh John Han and Suh Kabhee
Bought by
Suh John Han and Suh Kab Hee
Create a Home Valuation Report for This Property
The Home Valuation Report is an in-depth analysis detailing your home's value as well as a comparison with similar homes in the area
Home Values in the Area
Average Home Value in this Area
Purchase History
| Date | Buyer | Sale Price | Title Company |
|---|---|---|---|
| Thompson 2024 Revocable Trust | -- | None Listed On Document | |
| Thompson Beaux Alegri | $697,000 | Chicago Title Company | |
| Suh John Han | -- | None Available |
Source: Public Records
Mortgage History
| Date | Status | Borrower | Loan Amount |
|---|---|---|---|
| Previous Owner | Thompson Beaux Alegri | $557,600 |
Source: Public Records
Tax History Compared to Growth
Tax History
| Year | Tax Paid | Tax Assessment Tax Assessment Total Assessment is a certain percentage of the fair market value that is determined by local assessors to be the total taxable value of land and additions on the property. | Land | Improvement |
|---|---|---|---|---|
| 2025 | $9,792 | $825,101 | $443,922 | $381,179 |
| 2024 | $9,615 | $808,923 | $435,218 | $373,705 |
| 2023 | $9,615 | $793,063 | $426,685 | $366,378 |
| 2022 | $9,495 | $777,514 | $418,319 | $359,195 |
| 2021 | $9,269 | $762,269 | $410,117 | $352,152 |
| 2019 | $10,947 | $739,661 | $397,953 | $341,708 |
| 2018 | $10,601 | $725,158 | $390,150 | $335,008 |
| 2017 | $10,296 | $710,940 | $382,500 | $328,440 |
| 2016 | $10,010 | $697,000 | $375,000 | $322,000 |
| 2015 | $4,544 | $366,913 | $148,324 | $218,589 |
| 2014 | $4,452 | $359,727 | $145,419 | $214,308 |
Source: Public Records
Map
Nearby Homes
- 5900 High St
- 7 Atchinson Stage Rd
- 980 Oak St
- 1341 Maryland Dr
- 50 Nottingham Place
- 5549 Pennsylvania Blvd
- 5540 Michigan Blvd
- 1152 Via Doble
- 581 Mt Dell Dr
- 814 Chert Place
- 1280 Shell Cir
- 41 Mt Shasta Place
- 1295 Shell Cir Unit 1
- 1498 Delaware Dr
- 5506 Alaska Dr
- 337 Saclan Terrace
- 23 Mt Wilson Way
- 5503 Nebraska Dr
- 5501 Nebraska Dr
- 1370 Washington Blvd
- 5748 Tamarack Way
- 5747 Amaranth Place
- 5757 Tamarack Way
- 5745 Amaranth Place
- 5760 Tamarack Way
- 5770 Tamarack Way
- 5749 Tamarack Way
- 5746 Tamarack Way
- 5746 Amaranth Place
- 5747 Tamarack Way
- 35 Rhine Ct
- 1206 Amaranth Way
- 5740 Amaranth Place
- 30 Rhine Ct
- 5817 Mitchell Canyon Ct
- 5745 Tamarack Way
- 1210 Amaranth Way
- 5811 Mitchell Canyon Ct
- 901 Mitchell Canyon Ln
- 5747 Lewis Way