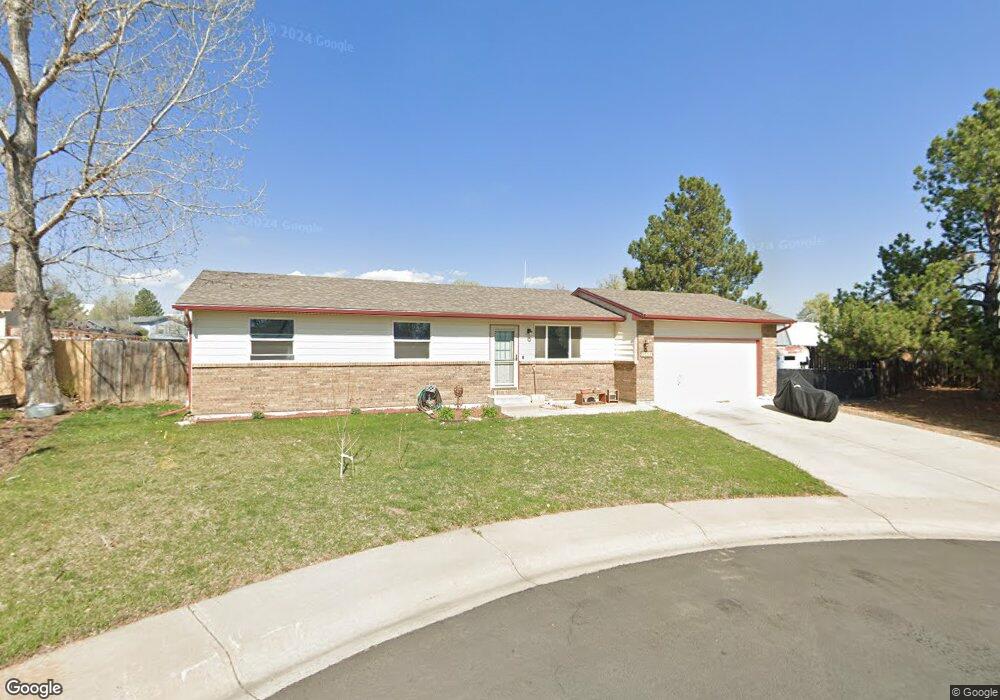
5751 Colby St Fort Collins, CO 80525
Huntington Hills NeighborhoodEstimated Value: $441,199 - $466,000
1
Bed
1
Bath
1,008
Sq Ft
$446/Sq Ft
Est. Value
About This Home
This home is located at 5751 Colby St, Fort Collins, CO 80525 and is currently estimated at $450,050, approximately $446 per square foot. 5751 Colby St is a home located in Larimer County with nearby schools including Werner Elementary School, Preston Middle School, and Fossil Ridge High School.
Ownership History
Date
Name
Owned For
Owner Type
Purchase Details
Closed on
Dec 17, 2021
Sold by
Pruitt Patricia Marie and Archer Cheryl
Bought by
Pruitt Patricia Marie
Current Estimated Value
Home Financials for this Owner
Home Financials are based on the most recent Mortgage that was taken out on this home.
Original Mortgage
$293,040
Outstanding Balance
$269,047
Interest Rate
2.98%
Mortgage Type
FHA
Estimated Equity
$181,003
Purchase Details
Closed on
Aug 22, 2003
Sold by
Pruitt Patricia Marie
Bought by
Pruitt Patricia Marie and Archer Cheryl
Home Financials for this Owner
Home Financials are based on the most recent Mortgage that was taken out on this home.
Original Mortgage
$160,200
Interest Rate
6.08%
Mortgage Type
Purchase Money Mortgage
Purchase Details
Closed on
Feb 1, 1995
Sold by
Trinklein Helen
Bought by
Pruitt Patricia Marie
Purchase Details
Closed on
Aug 1, 1993
Sold by
Oconnor Susan A
Bought by
Trinklein Helen
Create a Home Valuation Report for This Property
The Home Valuation Report is an in-depth analysis detailing your home's value as well as a comparison with similar homes in the area
Home Values in the Area
Average Home Value in this Area
Purchase History
| Date | Buyer | Sale Price | Title Company |
|---|---|---|---|
| Pruitt Patricia Marie | -- | Amrock | |
| Pruitt Patricia Marie | -- | Chicago Title Co | |
| Pruitt Patricia Marie | $103,000 | -- | |
| Trinklein Helen | $82,000 | -- |
Source: Public Records
Mortgage History
| Date | Status | Borrower | Loan Amount |
|---|---|---|---|
| Open | Pruitt Patricia Marie | $293,040 | |
| Closed | Pruitt Patricia Marie | $160,200 |
Source: Public Records
Tax History Compared to Growth
Tax History
| Year | Tax Paid | Tax Assessment Tax Assessment Total Assessment is a certain percentage of the fair market value that is determined by local assessors to be the total taxable value of land and additions on the property. | Land | Improvement |
|---|---|---|---|---|
| 2025 | $2,426 | $28,515 | $10,519 | $17,996 |
| 2024 | $2,312 | $28,515 | $10,519 | $17,996 |
| 2022 | $2,057 | $21,337 | $3,684 | $17,653 |
| 2021 | $2,080 | $21,951 | $3,790 | $18,161 |
| 2020 | $1,956 | $20,464 | $3,790 | $16,674 |
| 2019 | $1,963 | $20,464 | $3,790 | $16,674 |
| 2018 | $1,436 | $15,422 | $3,816 | $11,606 |
| 2017 | $1,432 | $15,422 | $3,816 | $11,606 |
| 2016 | $1,313 | $14,073 | $4,219 | $9,854 |
| 2015 | $1,303 | $14,070 | $4,220 | $9,850 |
| 2014 | $1,225 | $13,140 | $4,220 | $8,920 |
Source: Public Records
Map
Nearby Homes
- 306 Saturn Dr
- 5942 Colby St
- 433 Huntington Hills Dr
- 5925 Auburn Dr
- 508 Shadbury Ct
- 102 Fossil Ct W
- 5509 Fossil Ridge Dr E
- 5620 Fossil Creek Pkwy Unit 302
- 5620 Fossil Creek Pkwy Unit 3204
- 5620 Fossil Creek Pkwy Unit 2205
- 5620 Fossil Creek Pkwy Unit 6303
- 5902 Huntington Hills Dr
- 715 Yarnell Ct
- 117 Cameron Dr
- 5213 Castle Ridge Place
- 301 Uranus St
- 217 W Trilby Rd
- 225 W Trilby Rd
- 811 Hilldale Dr
- 1118 Deercroft Ct