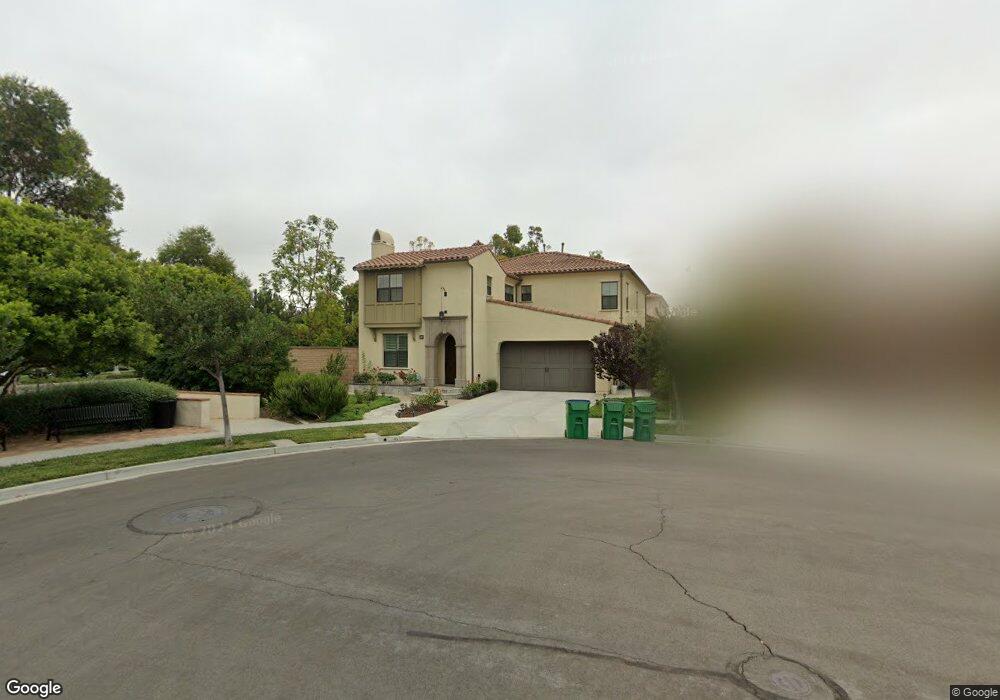
58 Constantine Irvine, CA 92620
Woodbury and Stonegate NeighborhoodEstimated Value: $3,083,574 - $3,454,000
4
Beds
5
Baths
3,882
Sq Ft
$841/Sq Ft
Est. Value
About This Home
This home is located at 58 Constantine, Irvine, CA 92620 and is currently estimated at $3,264,394, approximately $840 per square foot. 58 Constantine is a home with nearby schools including Jeffrey Trail Middle, Portola High School, and New Horizon Elementary School.
Ownership History
Date
Name
Owned For
Owner Type
Purchase Details
Closed on
Apr 28, 2014
Sold by
Brookfield Irvine Sixty Llc
Bought by
Liu Jack Chia Shen and Liu Yi Jean
Current Estimated Value
Purchase Details
Closed on
Jan 2, 2014
Sold by
Irvine Community Development Company Llc
Bought by
Brookfield Irvine Sixty Llc
Create a Home Valuation Report for This Property
The Home Valuation Report is an in-depth analysis detailing your home's value as well as a comparison with similar homes in the area
Home Values in the Area
Average Home Value in this Area
Purchase History
| Date | Buyer | Sale Price | Title Company |
|---|---|---|---|
| Liu Jack Chia Shen | $1,578,500 | First American Title | |
| Brookfield Irvine Sixty Llc | -- | First American Title Company |
Source: Public Records
Mortgage History
| Date | Status | Borrower | Loan Amount |
|---|---|---|---|
| Closed | Brookfield Irvine Sixty Llc | $0 |
Source: Public Records
Tax History
| Year | Tax Paid | Tax Assessment Tax Assessment Total Assessment is a certain percentage of the fair market value that is determined by local assessors to be the total taxable value of land and additions on the property. | Land | Improvement |
|---|---|---|---|---|
| 2025 | $22,479 | $1,934,641 | $993,516 | $941,125 |
| 2024 | $22,479 | $1,896,707 | $974,035 | $922,672 |
| 2023 | $22,712 | $1,859,517 | $954,936 | $904,581 |
| 2022 | $22,233 | $1,823,056 | $936,211 | $886,845 |
| 2021 | $21,842 | $1,787,310 | $917,854 | $869,456 |
| 2020 | $21,657 | $1,768,984 | $908,443 | $860,541 |
| 2019 | $22,018 | $1,734,299 | $890,631 | $843,668 |
| 2018 | $21,663 | $1,700,294 | $873,168 | $827,126 |
| 2017 | $21,303 | $1,666,955 | $856,047 | $810,908 |
| 2016 | $21,198 | $1,634,270 | $839,262 | $795,008 |
| 2015 | $20,924 | $1,609,722 | $826,655 | $783,067 |
| 2014 | $4,524 | $14,602 | $14,602 | $0 |
Source: Public Records
Map
Nearby Homes
- 65 Rolling Green
- 71 Clocktower
- 35 Twin Gables
- 57 Statuary
- 70 Twin Gables
- 125 Strawberry Grove
- 97 Twin Gables
- 2 Conifer
- 113 Hanging Gardens
- 37 Peony
- 149 Great Park Blvd
- 320 Bronze
- 40 Waterspout
- 17 City Stroll
- 142 Hedge Bloom Unit 83
- 79 Field Poppy
- 59 Midnight Sky
- 67 Sanctuary
- 16 Serenity
- 22 Sanctuary
Your Personal Tour Guide
Ask me questions while you tour the home.