Estimated Value: $77,000 - $156,000
4
Beds
2
Baths
1,512
Sq Ft
$83/Sq Ft
Est. Value
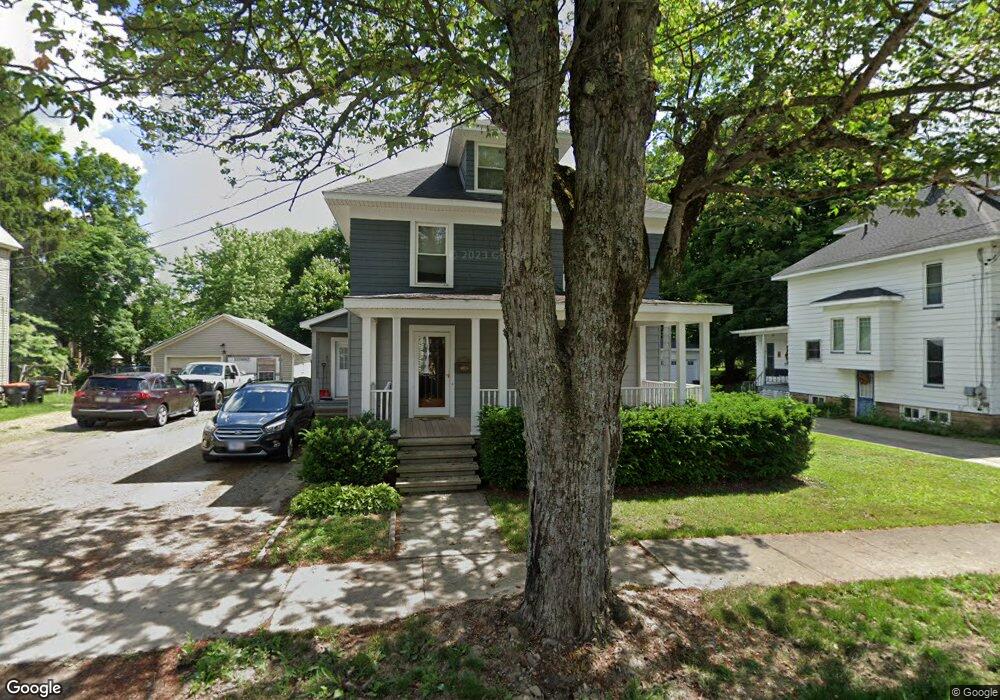
About This Home
This home is located at 58 E Bond St, Corry, PA 16407 and is currently estimated at $125,520, approximately $83 per square foot. 58 E Bond St is a home located in Erie County with nearby schools including Corry Area Primary School, Corry Area Intermediate School, and Corry Area Middle School.
Ownership History
Date
Name
Owned For
Owner Type
Purchase Details
Closed on
Oct 18, 2019
Sold by
Shannon Mercena A
Bought by
Smith Bryan M
Current Estimated Value
Home Financials for this Owner
Home Financials are based on the most recent Mortgage that was taken out on this home.
Original Mortgage
$45,000
Outstanding Balance
$30,001
Interest Rate
3.5%
Mortgage Type
Unknown
Estimated Equity
$95,519
Purchase Details
Closed on
Aug 24, 2009
Sold by
Smith Thomas B and Smith Mary S
Bought by
Smith Mary S and Smith Bryan M
Home Financials for this Owner
Home Financials are based on the most recent Mortgage that was taken out on this home.
Original Mortgage
$11,600
Interest Rate
5.36%
Mortgage Type
Unknown
Purchase Details
Closed on
Oct 17, 2002
Sold by
Fraser William H and Fraser Marian P
Bought by
Smith Thomas B and Smith Mary S
Create a Home Valuation Report for This Property
The Home Valuation Report is an in-depth analysis detailing your home's value as well as a comparison with similar homes in the area
Home Values in the Area
Average Home Value in this Area
Purchase History
| Date | Buyer | Sale Price | Title Company |
|---|---|---|---|
| Smith Bryan M | $50,000 | None Available | |
| Smith Mary S | -- | None Available | |
| Smith Thomas B | $73,000 | -- |
Source: Public Records
Mortgage History
| Date | Status | Borrower | Loan Amount |
|---|---|---|---|
| Open | Smith Bryan M | $45,000 | |
| Previous Owner | Smith Mary S | $11,600 | |
| Previous Owner | Smith Mary S | $54,000 |
Source: Public Records
Tax History
| Year | Tax Paid | Tax Assessment Tax Assessment Total Assessment is a certain percentage of the fair market value that is determined by local assessors to be the total taxable value of land and additions on the property. | Land | Improvement |
|---|---|---|---|---|
| 2025 | $2,078 | $63,540 | $12,100 | $51,440 |
| 2024 | $2,064 | $63,540 | $12,100 | $51,440 |
| 2023 | $2,014 | $63,540 | $12,100 | $51,440 |
| 2022 | $1,976 | $63,540 | $12,100 | $51,440 |
| 2021 | $1,961 | $63,540 | $12,100 | $51,440 |
| 2020 | $1,946 | $63,540 | $12,100 | $51,440 |
| 2019 | $1,915 | $63,540 | $12,100 | $51,440 |
| 2018 | $1,889 | $63,540 | $12,100 | $51,440 |
| 2017 | $1,856 | $63,540 | $12,100 | $51,440 |
| 2016 | $1,840 | $63,540 | $12,100 | $51,440 |
| 2015 | $1,824 | $63,540 | $12,100 | $51,440 |
| 2014 | $697 | $63,540 | $12,100 | $51,440 |
Source: Public Records
Map
Nearby Homes
- 535 Wright St
- 27 W Frederick St
- 35 W Smith St
- 110-118 W Smith and 307 Grace St
- 820 Mead Ave
- 1026 N Center St
- 515 Catherine St
- 837 Us Highway 6
- 318 Worth St
- 533 E South St
- 503 W Washington St
- 425 E Pleasant St
- 219 Summer St
- 433 E Pleasant St
- 238 York St
- 40 Marion St
- 538 Grand St
- 1249 White St
- 46375 6th St
- 132 Random Rd
Your Personal Tour Guide
Ask me questions while you tour the home.