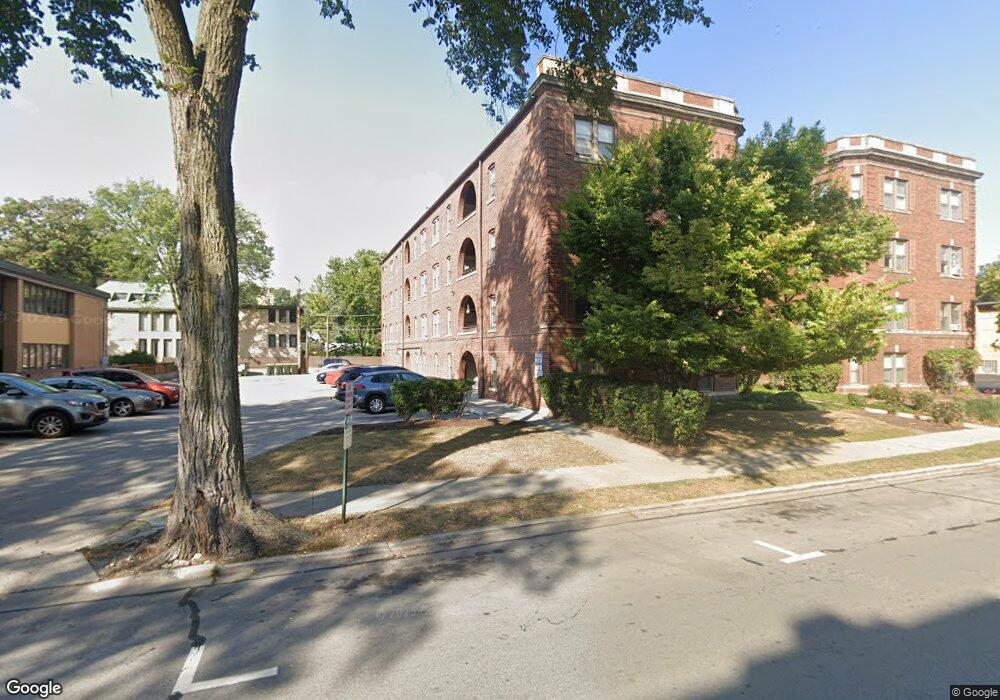
58 Forest Ave Unit 1N Riverside, IL 60546
Estimated Value: $130,000 - $154,000
1
Bed
1
Bath
551
Sq Ft
$256/Sq Ft
Est. Value
About This Home
This home is located at 58 Forest Ave Unit 1N, Riverside, IL 60546 and is currently estimated at $140,856, approximately $255 per square foot. 58 Forest Ave Unit 1N is a home located in Cook County with nearby schools including Central Elementary School, L J Hauser Jr High School, and Riverside Brookfield High School.
Ownership History
Date
Name
Owned For
Owner Type
Purchase Details
Closed on
Apr 3, 2017
Sold by
Federal Home Loan Mortgage Corporation
Bought by
Carl Adam J
Current Estimated Value
Home Financials for this Owner
Home Financials are based on the most recent Mortgage that was taken out on this home.
Original Mortgage
$665,000
Outstanding Balance
$555,671
Interest Rate
4.62%
Mortgage Type
New Conventional
Estimated Equity
-$414,815
Purchase Details
Closed on
Nov 4, 2016
Sold by
Crowley Steven C
Bought by
Federal Home Loan Mortgage Corporation
Purchase Details
Closed on
Jul 25, 2006
Sold by
Nu Concept Developers Llc
Bought by
Crowley Steven C
Home Financials for this Owner
Home Financials are based on the most recent Mortgage that was taken out on this home.
Original Mortgage
$153,800
Interest Rate
6.82%
Mortgage Type
Purchase Money Mortgage
Create a Home Valuation Report for This Property
The Home Valuation Report is an in-depth analysis detailing your home's value as well as a comparison with similar homes in the area
Home Values in the Area
Average Home Value in this Area
Purchase History
| Date | Buyer | Sale Price | Title Company |
|---|---|---|---|
| Carl Adam J | $70,000 | None Available | |
| Federal Home Loan Mortgage Corporation | -- | Attorney | |
| Crowley Steven C | $162,000 | Alliance Title Company |
Source: Public Records
Mortgage History
| Date | Status | Borrower | Loan Amount |
|---|---|---|---|
| Open | Carl Adam J | $665,000 | |
| Previous Owner | Crowley Steven C | $153,800 |
Source: Public Records
Tax History
| Year | Tax Paid | Tax Assessment Tax Assessment Total Assessment is a certain percentage of the fair market value that is determined by local assessors to be the total taxable value of land and additions on the property. | Land | Improvement |
|---|---|---|---|---|
| 2025 | $2,252 | $10,354 | $756 | $9,598 |
| 2024 | $2,252 | $10,354 | $756 | $9,598 |
| 2023 | $790 | $10,354 | $756 | $9,598 |
| 2022 | $790 | $6,338 | $646 | $5,692 |
| 2021 | $800 | $6,337 | $645 | $5,692 |
| 2020 | $2,256 | $6,337 | $645 | $5,692 |
| 2019 | $1,958 | $5,564 | $590 | $4,974 |
| 2018 | $1,901 | $5,564 | $590 | $4,974 |
| 2017 | $723 | $5,564 | $590 | $4,974 |
| 2016 | $1,070 | $5,536 | $497 | $5,039 |
| 2015 | $1,002 | $5,536 | $497 | $5,039 |
| 2014 | $1,004 | $5,536 | $497 | $5,039 |
| 2013 | $1,796 | $8,386 | $497 | $7,889 |
Source: Public Records
Map
Nearby Homes
- 78 Pine Ave
- 10 E Burlington St Unit 2C
- 10 E Burlington St Unit 2B
- 124 Forest Ave
- 220 Maplewood Rd
- 108 E Burlington St Unit B
- 236 Maplewood Rd
- 193 Herrick Rd
- 231 Bartram Rd
- 176 Riverside Rd
- 207 W Quincy St Unit GARD
- 213 W Quincy St Unit 1
- 269 Shenstone Rd
- 8117 W 30th St
- 305 Desplaines Ave
- 315 Bartram Rd
- 336 Fairbank Rd
- 280 Blackhawk Rd
- 284 Blackhawk Rd
- 262 Lionel Rd
- 58 Forest Ave Unit 3S
- 58 Forest Ave Unit 2N
- 58 Forest Ave Unit 582S
- 58 Forest Ave Unit 583S
- 58 Forest Ave Unit 583N
- 58 Forest Ave Unit 582N
- 58 Forest Ave Unit 581S
- 58 Forest Ave Unit 581N
- 58 Forest Ave Unit 58G
- 58 Forest Ave Unit 2S
- 58 Forest Ave Unit 3N
- 58 Forest Ave Unit G
- 56 Forest Ave Unit 2S
- 56 Forest Ave Unit 563N
- 56 Forest Ave Unit 563S
- 50 Forest Ave Unit 503S
- 50 Forest Ave Unit 503N
- 56 Forest Ave Unit 562S
- 56 Forest Ave Unit 562N
- 50 Forest Ave Unit 502S
Your Personal Tour Guide
Ask me questions while you tour the home.