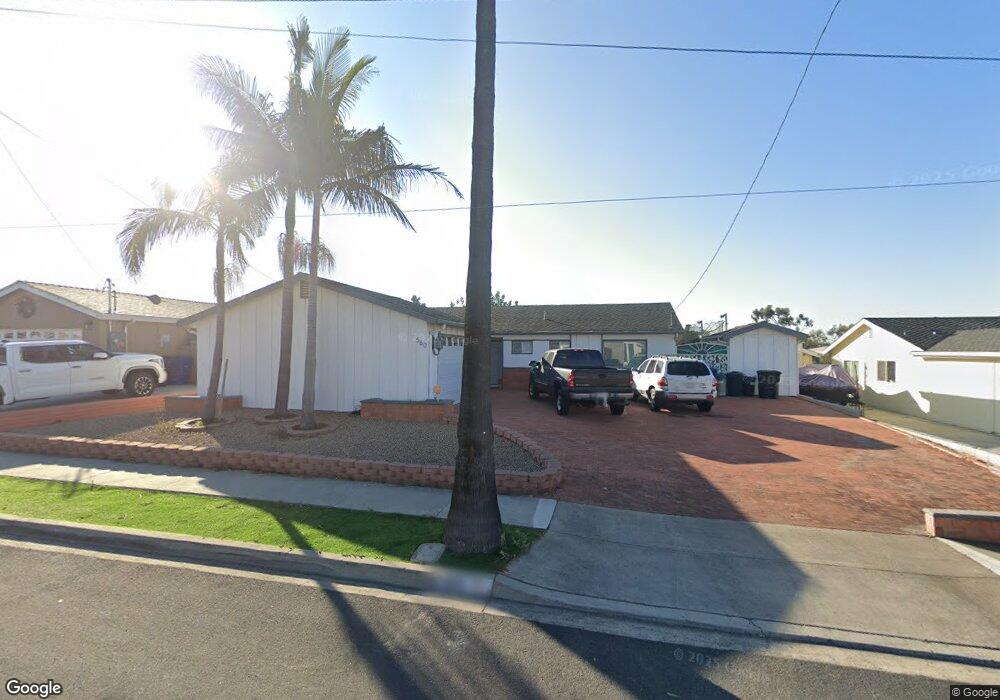
580 Fifield St Chula Vista, CA 91910
Rancho Del Rey NeighborhoodEstimated Value: $767,056 - $857,000
3
Beds
2
Baths
1,344
Sq Ft
$616/Sq Ft
Est. Value
About This Home
This home is located at 580 Fifield St, Chula Vista, CA 91910 and is currently estimated at $827,514, approximately $615 per square foot. 580 Fifield St is a home located in San Diego County with nearby schools including Halecrest Elementary School, Hilltop Middle School, and Hilltop Senior High School.
Ownership History
Date
Name
Owned For
Owner Type
Purchase Details
Closed on
Mar 7, 2000
Sold by
Leonard Jenkins and Leonard Annabel L
Bought by
Cubillas Miguel M
Current Estimated Value
Home Financials for this Owner
Home Financials are based on the most recent Mortgage that was taken out on this home.
Original Mortgage
$184,000
Interest Rate
8.34%
Mortgage Type
Balloon
Purchase Details
Closed on
Feb 17, 1999
Sold by
Jenkins Leonard S and Jenkins Annabel L
Bought by
Jenkins Leonard and Jenkins Annabel J
Home Financials for this Owner
Home Financials are based on the most recent Mortgage that was taken out on this home.
Original Mortgage
$35,000
Interest Rate
6.78%
Mortgage Type
Credit Line Revolving
Purchase Details
Closed on
Aug 13, 1997
Sold by
Jenkins Leonard S and Jenkins Annabel L
Bought by
Jenkins Leonard and Jenkins Annabel L
Purchase Details
Closed on
Jul 5, 1991
Purchase Details
Closed on
Jul 19, 1985
Create a Home Valuation Report for This Property
The Home Valuation Report is an in-depth analysis detailing your home's value as well as a comparison with similar homes in the area
Home Values in the Area
Average Home Value in this Area
Purchase History
| Date | Buyer | Sale Price | Title Company |
|---|---|---|---|
| Cubillas Miguel M | $230,000 | Commonwealth Land Title Co | |
| Jenkins Leonard | -- | Stewart Title | |
| Jenkins Leonard | -- | -- | |
| -- | $165,000 | -- | |
| -- | $108,900 | -- |
Source: Public Records
Mortgage History
| Date | Status | Borrower | Loan Amount |
|---|---|---|---|
| Closed | Cubillas Miguel M | $184,000 | |
| Previous Owner | Jenkins Leonard | $35,000 |
Source: Public Records
Tax History
| Year | Tax Paid | Tax Assessment Tax Assessment Total Assessment is a certain percentage of the fair market value that is determined by local assessors to be the total taxable value of land and additions on the property. | Land | Improvement |
|---|---|---|---|---|
| 2025 | $4,085 | $353,480 | $122,947 | $230,533 |
| 2024 | $4,085 | $346,550 | $120,537 | $226,013 |
| 2023 | $4,029 | $339,756 | $118,174 | $221,582 |
| 2022 | $3,914 | $333,095 | $115,857 | $217,238 |
| 2021 | $3,823 | $326,565 | $113,586 | $212,979 |
| 2020 | $3,732 | $323,218 | $112,422 | $210,796 |
| 2019 | $3,636 | $316,881 | $110,218 | $206,663 |
| 2018 | $3,580 | $310,668 | $108,057 | $202,611 |
| 2017 | $3,505 | $304,578 | $105,939 | $198,639 |
| 2016 | $3,424 | $298,607 | $103,862 | $194,745 |
| 2015 | $3,375 | $294,122 | $102,302 | $191,820 |
| 2014 | $3,320 | $288,362 | $100,299 | $188,063 |
Source: Public Records
Map
Nearby Homes
- 607 E J St
- 991 Calma Dr
- 1008 Calma Dr
- 476 Montclair St
- 376 Roman Way
- 445 Montcalm St
- 939 Nolan Way
- 919 Caminito Estrella
- 1139 Ocelot Ave
- 902 Monterey Ct
- 835 Cedarbend Way
- 953 Maria Way
- 664 Rainbow Dr
- 1201 Halley Ct
- 466 Thrush St
- 417 Sanibelle Cir Unit 91
- 871 Blackwood Rd
- 820 Cardamom Ct
- 453 Hidden Vista Dr
- 202 E J St
Your Personal Tour Guide
Ask me questions while you tour the home.