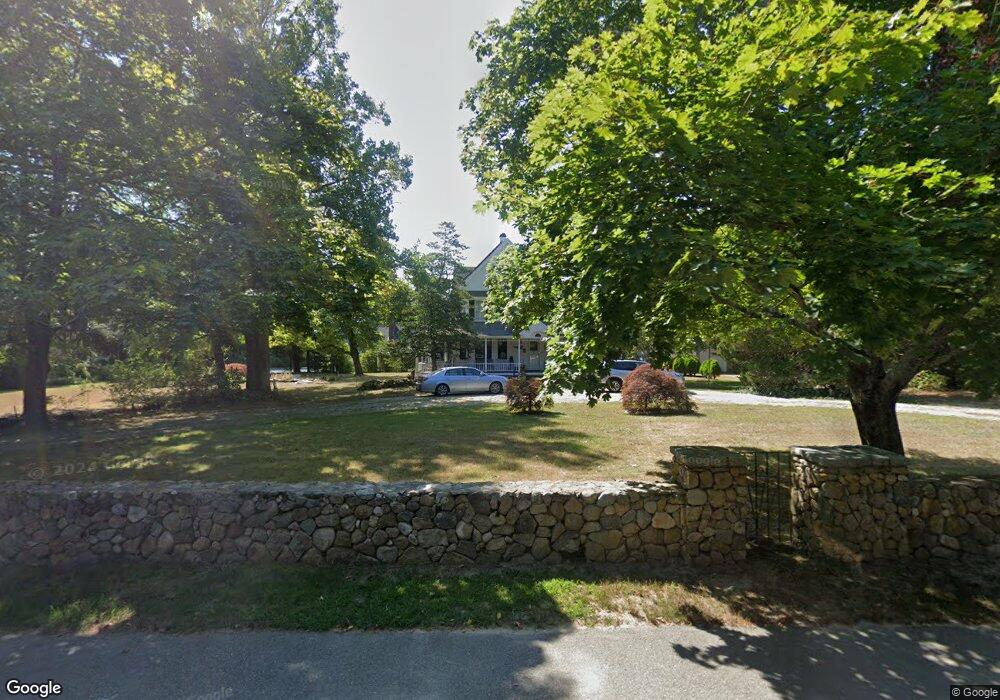
581 Main St Cotuit, MA 02635
Cotuit NeighborhoodEstimated Value: $1,171,573 - $1,814,000
4
Beds
3
Baths
2,697
Sq Ft
$512/Sq Ft
Est. Value
About This Home
This home is located at 581 Main St, Cotuit, MA 02635 and is currently estimated at $1,380,393, approximately $511 per square foot. 581 Main St is a home located in Barnstable County with nearby schools including West Villages Elementary School, Barnstable United Elementary School, and Barnstable Intermediate School.
Ownership History
Date
Name
Owned For
Owner Type
Purchase Details
Closed on
Oct 12, 2021
Sold by
Mclean Martha J and Mclean John S
Bought by
Mclean Ret and Mclean
Current Estimated Value
Purchase Details
Closed on
Feb 9, 2005
Sold by
Mclean Martha J
Bought by
Mclean John S and Mclean Martha J
Purchase Details
Closed on
Oct 6, 1997
Sold by
Robinson William C and Robinson Virginia D
Bought by
Mclean Martha J
Create a Home Valuation Report for This Property
The Home Valuation Report is an in-depth analysis detailing your home's value as well as a comparison with similar homes in the area
Home Values in the Area
Average Home Value in this Area
Purchase History
| Date | Buyer | Sale Price | Title Company |
|---|---|---|---|
| Mclean Ret | -- | None Available | |
| Mclean John S | -- | -- | |
| Mclean Martha J | $300,000 | -- |
Source: Public Records
Mortgage History
| Date | Status | Borrower | Loan Amount |
|---|---|---|---|
| Previous Owner | Mclean Martha J | $293,375 | |
| Previous Owner | Mclean Martha J | $304,000 | |
| Previous Owner | Mclean Martha J | $232,650 |
Source: Public Records
Tax History
| Year | Tax Paid | Tax Assessment Tax Assessment Total Assessment is a certain percentage of the fair market value that is determined by local assessors to be the total taxable value of land and additions on the property. | Land | Improvement |
|---|---|---|---|---|
| 2025 | $8,624 | $1,032,800 | $381,100 | $651,700 |
| 2024 | $8,146 | $1,033,700 | $381,100 | $652,600 |
| 2023 | $7,665 | $915,800 | $354,300 | $561,500 |
| 2022 | $7,443 | $719,800 | $245,000 | $474,800 |
| 2021 | $7,374 | $667,900 | $268,300 | $399,600 |
| 2020 | $7,520 | $642,200 | $268,300 | $373,900 |
| 2019 | $7,110 | $598,500 | $280,000 | $318,500 |
| 2018 | $6,484 | $545,800 | $282,400 | $263,400 |
| 2017 | $6,394 | $541,900 | $282,400 | $259,500 |
| 2016 | $6,171 | $536,100 | $276,600 | $259,500 |
| 2015 | $6,521 | $566,100 | $279,800 | $286,300 |
Source: Public Records
Map
Nearby Homes
- 552 Main St
- 804 Main St
- 135 Putnam Avenue (Land)
- 239 Oxford Dr
- 181 School St
- 7 Oxford Dr
- 925 Main St Unit 3
- 10 Abbey Gate Rd
- 33 Oyster Place Rd
- 1820 Santuit Newtown Rd
- 15 Riverview Ave Unit D
- 15 Riverview Ave Unit D
- 602 Putnam Ave
- 16 Cedar St
- 226 Dunrobin Rd
- 70 Cape Dr Unit 14D
- 70 Cape Dr Unit 15D
- 70 Cape Dr Unit 11D
- 70 Cape Dr Unit 15D
- 70 Cape Dr Unit 11D
Your Personal Tour Guide
Ask me questions while you tour the home.