Estimated Value: $96,000 - $338,000
2
Beds
1
Bath
1,123
Sq Ft
$215/Sq Ft
Est. Value
About This Home
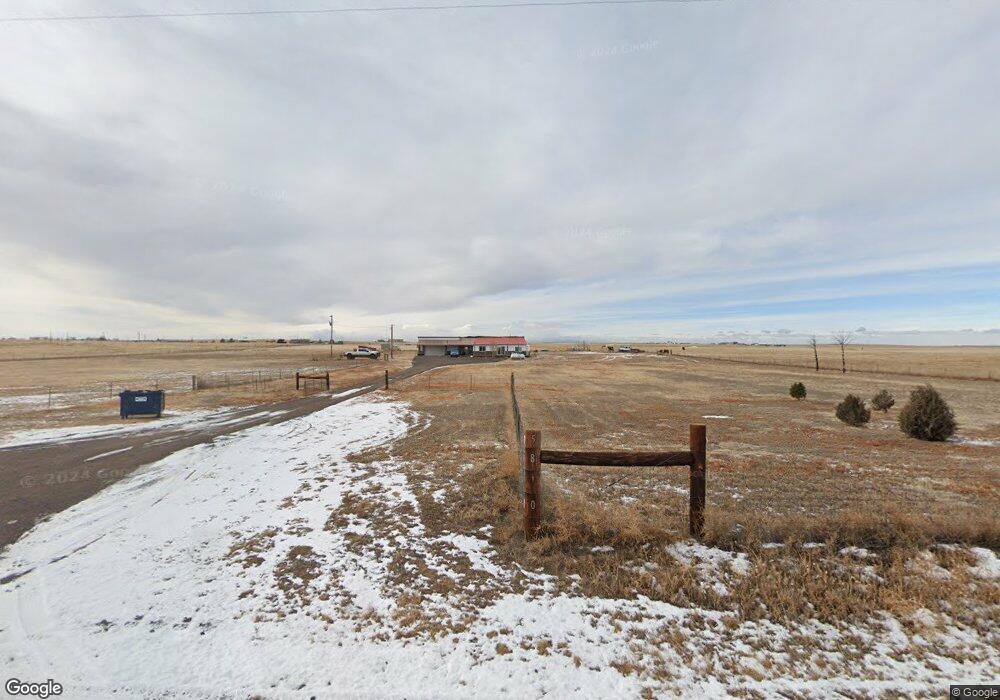
This home is located at 5810 Boone Rd, Yoder, CO 80864 and is currently estimated at $241,597, approximately $215 per square foot. 5810 Boone Rd is a home located in El Paso County with nearby schools including Miami/Yoder Elementary School and Miami-Yoder Middle - High School.
Ownership History
Date
Name
Owned For
Owner Type
Purchase Details
Closed on
Feb 10, 2025
Sold by
Akim Llc
Bought by
Burney Duane E and Burney Maria E
Current Estimated Value
Purchase Details
Closed on
Mar 1, 2016
Sold by
Burney Duane E and Burney Maria E
Bought by
Akim Llc
Purchase Details
Closed on
Feb 24, 2016
Sold by
Paul Margot E and Hart Nancy M
Bought by
Burney Duane E and Burney Marla E
Purchase Details
Closed on
Feb 9, 2012
Sold by
Paul Margot E
Bought by
Paul Margot E and Hart Nancy N
Purchase Details
Closed on
Sep 7, 1983
Bought by
Akim Llc
Purchase Details
Closed on
Dec 20, 1979
Bought by
Akim Llc
Create a Home Valuation Report for This Property
The Home Valuation Report is an in-depth analysis detailing your home's value as well as a comparison with similar homes in the area
Home Values in the Area
Average Home Value in this Area
Purchase History
| Date | Buyer | Sale Price | Title Company |
|---|---|---|---|
| Burney Duane E | -- | None Listed On Document | |
| Akim Llc | -- | None Available | |
| Burney Duane E | $50,000 | None Available | |
| Paul Margot E | -- | None Available | |
| Akim Llc | -- | -- | |
| Akim Llc | -- | -- |
Source: Public Records
Tax History
| Year | Tax Paid | Tax Assessment Tax Assessment Total Assessment is a certain percentage of the fair market value that is determined by local assessors to be the total taxable value of land and additions on the property. | Land | Improvement |
|---|---|---|---|---|
| 2025 | $147 | $25,950 | -- | -- |
| 2024 | $54 | $8,170 | $4,860 | $3,310 |
| 2023 | $54 | $8,170 | $4,860 | $3,310 |
| 2022 | $269 | $6,980 | $3,480 | $3,500 |
| 2021 | $290 | $7,190 | $3,580 | $3,610 |
| 2020 | $250 | $5,930 | $3,130 | $2,800 |
| 2019 | $255 | $5,930 | $3,130 | $2,800 |
| 2018 | $235 | $5,210 | $2,720 | $2,490 |
| 2017 | $223 | $5,210 | $2,720 | $2,490 |
| 2016 | $108 | $4,980 | $2,860 | $2,120 |
| 2015 | $118 | $5,440 | $2,860 | $2,580 |
| 2014 | $147 | $5,170 | $2,860 | $2,310 |
Source: Public Records
Map
Nearby Homes
- 6190 Night Train Ln
- 6325 Night Train Ln
- 32775 Truckton Rd
- 33455 Fossinger Rd
- 7825 Boone Rd
- 8450 Edison Rd
- 6760 S Yoder Rd
- 37188 Truckton Rd
- 5025 Lauppe Rd
- 4875 Lauppe Rd
- 35520 Bowen Rd
- 28920 Sanborn Rd
- 29424 Sanborn Rd
- 0 Shear Rd
- 35140 Sanborn Rd
- 38115 Gieck Rd
- 39320 Truckton Rd
- 7455 S Rush Rd
- 0 S Rush Rd
- 0 Edison Rd
- 6130 Boone Rd
- 6160 Boone Rd
- 5825 Boone Rd
- 6150 Night Train Ln
- 6125 Night Train Ln
- 6145 Night Train Ln
- 6145 Night Train Ln Unit 18
- 6170 Night Train Ln
- 6280 Boone Rd
- 6350 Boone Rd
- 6275 Night Train Ln
- 6240 Night Train Ln
- 6220 Night Train Ln
- 6360 Boone Rd
- 5610 Boone Rd
- 6260 Night Train Ln
- 6280 Night Train Ln
- 6345 Night Train Ln
- 34480 Truckton Rd
- 6330 Night Train Ln
Your Personal Tour Guide
Ask me questions while you tour the home.