
Seller's Agent in 2025
Sandra Dole
Shasta Sotheby's International Realty
(707) 312-4699
2 in this area
137 Total Sales


Welcome to a home that blends care, comfort, and thoughtful design. This beautifully maintained single-owner residence in the desirable Northridge Gardens neighborhood offers 2,072 sq. ft. of single-level living near local colleges, schools, shopping, and I-5 access—plus it's just minutes from Lake Shasta.
The front yard greets you with a cascading water feature, setting a soothing tone as you enter. Inside, you'll find wood and tile flooring, granite countertops, and vaulted ceilings throughout an open, inviting layout. The home features 3 bedrooms plus an office with direct exterior access, ideal for remote work or flexible living. The spacious family room connects seamlessly to the kitchen and dining areas, creating an easy flow for everyday living and entertaining. Even the garage shows pride of ownership with tile flooring and custom paint.
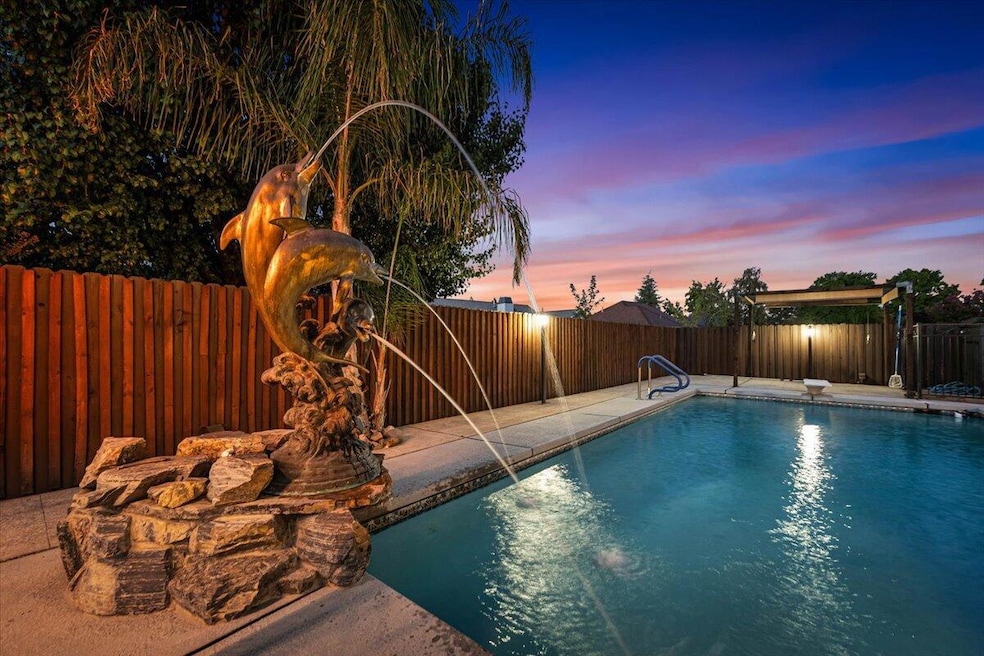
Outdoors, enjoy a sparkling gated pool with diving board and playful dolphin fountain, a built-in BBQ and serving area, and a large covered patio with ceiling fans and misting system for summer comfort. Gated RV parking and low-maintenance landscaping complete this move-in-ready home designed for convenience and enjoyment.
Located in a quiet, well-established neighborhood with a community park, this property offers the perfect blend of location, lifestyle, and livability.
Last Agent to Sell the Property
Shasta Sotheby's International Realty License #01895252 Listed on: 09/19/2025
| Date | Type | Sale Price | Title Company |
|---|---|---|---|
| Grant Deed | $542,000 | Fidelity National Title Compan | |
| Interfamily Deed Transfer | -- | None Available | |
| Interfamily Deed Transfer | -- | None Available | |
| Interfamily Deed Transfer | -- | None Available | |
| Interfamily Deed Transfer | -- | Alliance Title Company | |
| Interfamily Deed Transfer | $115,527 | Chicago Title |
| Date | Status | Loan Amount | Loan Type |
|---|---|---|---|
| Open | $405,800 | New Conventional | |
| Previous Owner | $266,640 | Stand Alone Refi Refinance Of Original Loan | |
| Previous Owner | $62,000 | Seller Take Back |
| Date | Event | Price | List to Sale | Price per Sq Ft |
|---|---|---|---|---|
| 12/18/2025 12/18/25 | Sold | $542,000 | -1.3% | $262 / Sq Ft |
| 12/08/2025 12/08/25 | Pending | -- | -- | -- |
| 10/29/2025 10/29/25 | Price Changed | $549,000 | -2.0% | $265 / Sq Ft |
| 09/19/2025 09/19/25 | For Sale | $560,000 | -- | $270 / Sq Ft |
| Year | Tax Paid | Tax Assessment Tax Assessment Total Assessment is a certain percentage of the fair market value that is determined by local assessors to be the total taxable value of land and additions on the property. | Land | Improvement |
|---|---|---|---|---|
| 2025 | $3,541 | $336,271 | $61,171 | $275,100 |
| 2024 | $3,473 | $329,678 | $59,972 | $269,706 |
| 2023 | $3,473 | $323,215 | $58,797 | $264,418 |
| 2022 | $3,379 | $316,879 | $57,645 | $259,234 |
| 2021 | $3,334 | $310,666 | $56,515 | $254,151 |
| 2020 | $3,319 | $307,481 | $55,936 | $251,545 |
| 2019 | $3,216 | $301,453 | $54,840 | $246,613 |
| 2018 | $3,215 | $295,543 | $53,765 | $241,778 |
| 2017 | $3,161 | $289,749 | $52,711 | $237,038 |
| 2016 | $2,951 | $277,569 | $51,678 | $225,891 |
| 2015 | $2,904 | $273,400 | $50,902 | $222,498 |
| 2014 | $2,924 | $268,045 | $49,905 | $218,140 |
Seller's Agent in 2025
Sandra Dole
Shasta Sotheby's International Realty
(707) 312-4699
2 in this area
137 Total Sales
C
Buyer's Agent in 2025
Christopher Ross
Josh Barker Real Estate
(530) 710-3274
2 in this area
115 Total Sales
Source: Shasta Association of REALTORS®
MLS Number: 25-4230
APN: 073-340-021-000
Disclaimer: Certain information contained herein is derived from information provided by parties other than Homes.com. All information provided is deemed reliable, but is not guaranteed to be accurate and should be independently verified.
![]() IDX information is provided exclusively for personal, non-commercial use, and may not be used for any purpose other than to identify prospective properties consumers may be interested in purchasing. Information is deemed reliable but not guaranteed.
IDX information is provided exclusively for personal, non-commercial use, and may not be used for any purpose other than to identify prospective properties consumers may be interested in purchasing. Information is deemed reliable but not guaranteed.
Ask me questions while you tour the home.