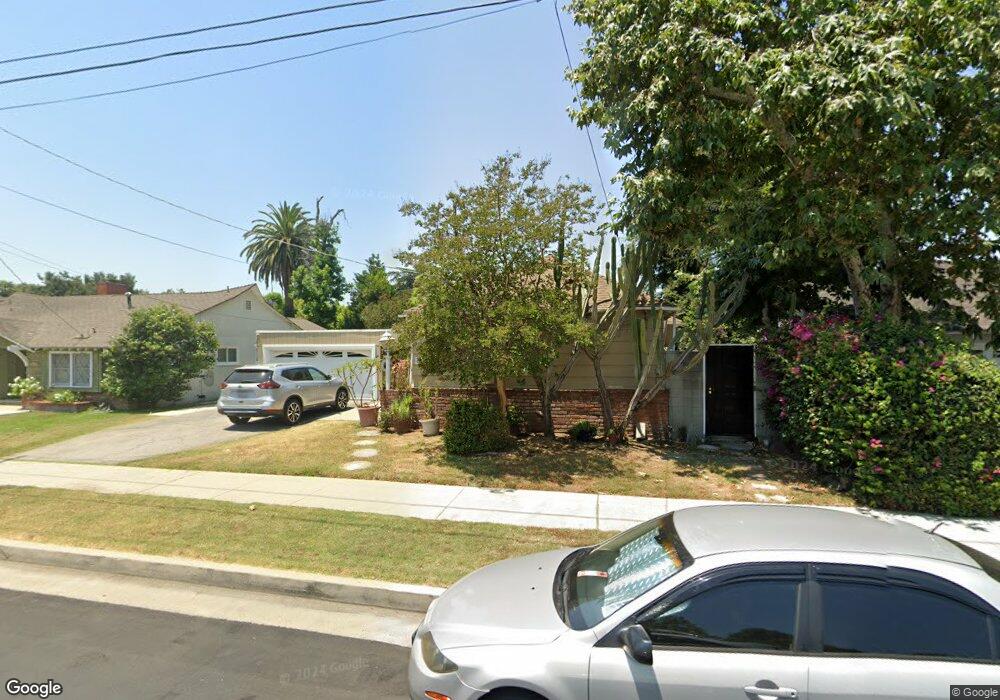
5849 Mammoth Ave van Nuys, CA 91401
Estimated Value: $1,329,030 - $1,432,000
2
Beds
2
Baths
2,272
Sq Ft
$604/Sq Ft
Est. Value
About This Home
This home is located at 5849 Mammoth Ave, van Nuys, CA 91401 and is currently estimated at $1,372,008, approximately $603 per square foot. 5849 Mammoth Ave is a home located in Los Angeles County with nearby schools including Erwin Street Elementary School, Ulysses S. Grant Senior High School, and Ivy Bound Academy of Math Sci and Tech Charter Middle.
Ownership History
Date
Name
Owned For
Owner Type
Purchase Details
Closed on
Feb 23, 2011
Sold by
Rosendahl Lea
Bought by
Rosendahl Lea and The 1992 Tov Trust
Current Estimated Value
Purchase Details
Closed on
Sep 29, 2010
Sold by
Rosendahl Lea and The 1992 Tov Trust
Bought by
Rosendahl Lea
Purchase Details
Closed on
Sep 15, 2010
Sold by
Rosendahl Lea and The 1992 Tov Trust
Bought by
D B L R One Llc
Purchase Details
Closed on
Dec 29, 1993
Sold by
Rosendahl Lea
Bought by
Rosendahl Lea
Home Financials for this Owner
Home Financials are based on the most recent Mortgage that was taken out on this home.
Original Mortgage
$193,500
Interest Rate
6.85%
Purchase Details
Closed on
Nov 16, 1993
Sold by
Rosendahl Lea
Bought by
Rosendahl Lea
Home Financials for this Owner
Home Financials are based on the most recent Mortgage that was taken out on this home.
Original Mortgage
$193,500
Interest Rate
6.85%
Create a Home Valuation Report for This Property
The Home Valuation Report is an in-depth analysis detailing your home's value as well as a comparison with similar homes in the area
Home Values in the Area
Average Home Value in this Area
Purchase History
| Date | Buyer | Sale Price | Title Company |
|---|---|---|---|
| Rosendahl Lea | -- | None Available | |
| Rosendahl Lea | -- | None Available | |
| D B L R One Llc | -- | None Available | |
| Rosendahl Lea | -- | -- | |
| Rosendahl Lea | -- | Investors Title Company |
Source: Public Records
Mortgage History
| Date | Status | Borrower | Loan Amount |
|---|---|---|---|
| Previous Owner | Rosendahl Lea | $193,500 |
Source: Public Records
Tax History
| Year | Tax Paid | Tax Assessment Tax Assessment Total Assessment is a certain percentage of the fair market value that is determined by local assessors to be the total taxable value of land and additions on the property. | Land | Improvement |
|---|---|---|---|---|
| 2025 | $5,631 | $440,959 | $175,255 | $265,704 |
| 2024 | $5,631 | $432,314 | $171,819 | $260,495 |
| 2023 | $5,528 | $423,838 | $168,450 | $255,388 |
| 2022 | $5,281 | $415,529 | $165,148 | $250,381 |
| 2021 | $5,208 | $407,382 | $161,910 | $245,472 |
| 2019 | $5,058 | $395,300 | $157,108 | $238,192 |
| 2018 | $4,927 | $387,550 | $154,028 | $233,522 |
| 2016 | $4,694 | $372,503 | $148,048 | $224,455 |
| 2015 | $4,628 | $366,909 | $145,825 | $221,084 |
| 2014 | $4,650 | $359,723 | $142,969 | $216,754 |
Source: Public Records
Map
Nearby Homes
- 5923 Woodman Ave
- 5753 Mammoth Ave
- 13822 Oxnard St
- 5914 Colbath Ave
- 5906 Colbath Ave
- 13942 Oxnard St
- 5738 Buffalo Ave
- 13744 Bessemer St
- 13816 Bessemer St
- 5636 Matilija Ave
- 6044 Woodman Ave
- 13831 Bessemer St
- 14024 Califa St
- 13633 Delano St
- 6038 Allott Ave
- 13559 Burbank Blvd
- 5544 Colbath Ave
- 13522 Delano St
- 5744 Stansbury Ave
- 13430 Oxnard St
- 5843 Mammoth Ave
- 5855 Mammoth Ave
- 13746 Califa St
- 5837 Mammoth Ave
- 5837 Mammoth
- 5837 Mammoth Ave
- 13752 Califa St
- 5850 Mammoth Ave
- 5844 Mammoth Ave
- 5831 Mammoth Ave
- 5836 Matilija Ave
- 5831 Mammoth Ave
- 5856 Mammoth Ave
- 5838 Mammoth Ave
- 5832 Matilija Ave
- 13760 Califa St
- 5905 Mammoth Ave
- 13802 Califa St
- 5832 Mammoth Ave
- 13745 Califa St
Your Personal Tour Guide
Ask me questions while you tour the home.