
Seller's Agent in 2021
Frieda Manning
Fireside Realty
(408) 506-5617
2 in this area
28 Total Sales
Estimated Value: $606,000 - $675,000
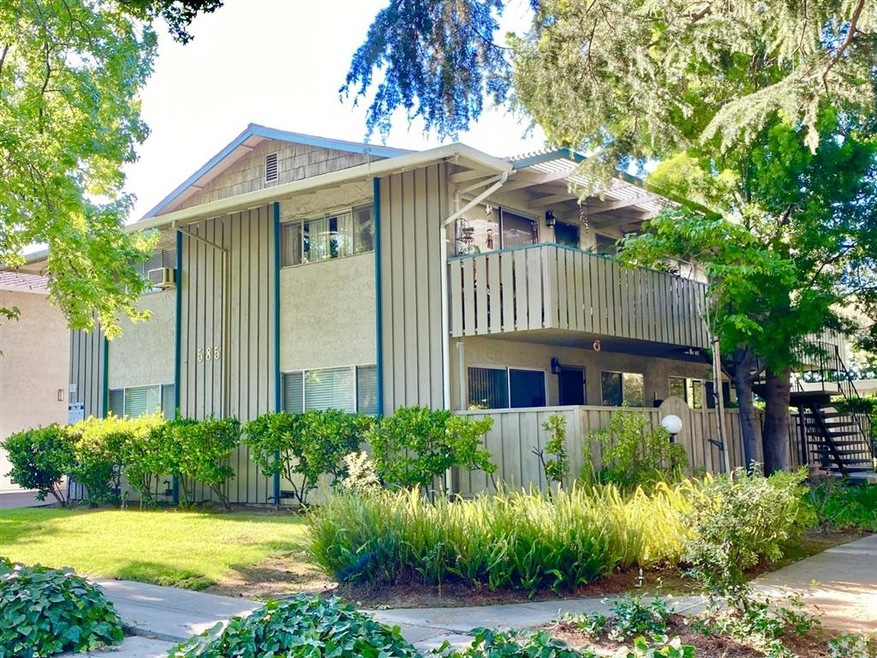
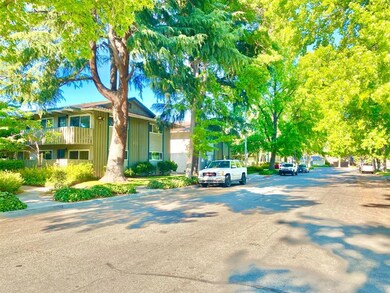
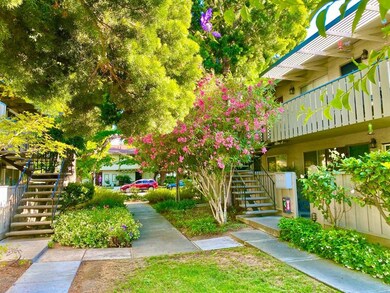
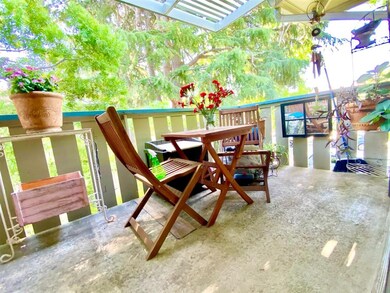
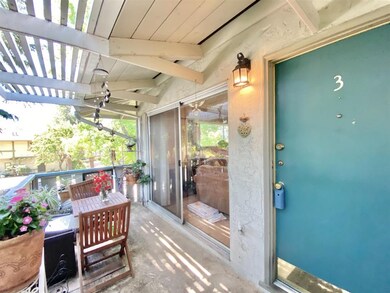
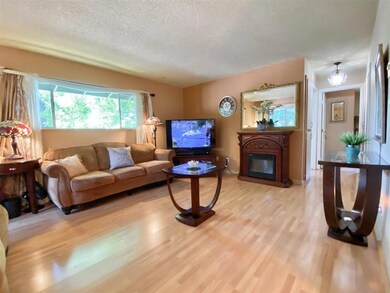
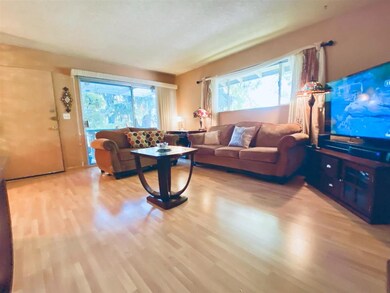
Location...Location...,Lovely 2 bedroom home nestled in the QUIET corner, among breathtaking mature trees, near Downtown Campbel!! Beautifully remodeled kitchen with quality dark Cherry cabinets & gorgeous granite slab counters** Stainless steel appliances are all included** gleaming Pergo flooring throughout**Oversized full bathroom with tile floors, dual vanity, plus the extra cabinets** Shower over tub with updated marble walls** Spacious living room with the view of the lush nature, next to a cozy dining area** A/C Unit, Spacious patio to BBQ & enjoy the beautiful surronding nature** Covered Parking**Near by Pruneyard Center, Santana Row, Valley Fair Mall, Hwy 17/280/880/San Thomas Expw and High Tech Companies. Great Campbell Schools** Centrally located within Silicon Valley. Low HOA fees $290, includes water, sewer, garbage, roof, landscaping and much more!! Laundry room is near, in the back of the building** A must see Location & Home! Thanks :)
Last Agent to Sell the Property
Fireside Realty License #01194313 Listed on: 06/18/2021
| Date | Buyer | Sale Price | Title Company |
|---|---|---|---|
| Hsia Ting-Yuan | $628,000 | Chicago Title | |
| Aranda Javier | $525,000 | Old Republic Title | |
| Morales Lourdes M | $143,000 | Chicago Title Co | |
| Candia Michelle E | $100,000 | Old Republic Title Company | |
| Candia Michelle E | -- | Old Republic Title Company |
| Date | Status | Borrower | Loan Amount |
|---|---|---|---|
| Open | Hsia Ting-Yuan | $150,000 | |
| Previous Owner | Aranda Javier | $472,447 | |
| Previous Owner | Morales Lourdes M | $93,000 | |
| Previous Owner | Candia Michelle E | $95,450 |
| Date | Event | Price | List to Sale | Price per Sq Ft |
|---|---|---|---|---|
| 07/30/2021 07/30/21 | Sold | $525,000 | +5.2% | $625 / Sq Ft |
| 06/25/2021 06/25/21 | Pending | -- | -- | -- |
| 06/18/2021 06/18/21 | For Sale | $498,900 | -- | $594 / Sq Ft |
| Year | Tax Paid | Tax Assessment Tax Assessment Total Assessment is a certain percentage of the fair market value that is determined by local assessors to be the total taxable value of land and additions on the property. | Land | Improvement |
|---|---|---|---|---|
| 2025 | $8,401 | $640,560 | $320,280 | $320,280 |
| 2024 | $8,401 | $628,000 | $314,000 | $314,000 |
| 2023 | $7,218 | $520,000 | $260,000 | $260,000 |
| 2022 | $7,390 | $525,000 | $262,500 | $262,500 |
| 2021 | $3,448 | $210,921 | $126,555 | $84,366 |
| 2020 | $3,348 | $208,759 | $125,258 | $83,501 |
| 2019 | $3,283 | $204,666 | $122,802 | $81,864 |
| 2018 | $3,176 | $200,654 | $120,395 | $80,259 |
| 2017 | $3,114 | $196,721 | $118,035 | $78,686 |
| 2016 | $2,920 | $192,865 | $115,721 | $77,144 |
| 2015 | $2,846 | $189,969 | $113,983 | $75,986 |
| 2014 | $2,678 | $186,249 | $111,751 | $74,498 |
Seller's Agent in 2021
Frieda Manning
Fireside Realty
(408) 506-5617
2 in this area
28 Total Sales
Source: MLSListings
MLS Number: ML81849549
APN: 305-45-019
Disclaimer: Certain information contained herein is derived from information provided by parties other than Homes.com. All information provided is deemed reliable, but is not guaranteed to be accurate and should be independently verified.
![]() Property Information © 2025 MLSListings Inc. All rights reserved. Listing information is deemed reliable but not guaranteed. Certain information contained herein is derived from information which is the licensed property of, and copyrighted by, MLSListings Inc. The viewer acknowledges ownership and validity of its copyright. Information provided is for personal, non-commercial use by a viewer with a bona fide interest in the purchase or sale of real estate of the type being offered via this website or other electronic means. The viewer is prohibited from copying, redistributing or retransmitting any of the data or information provided by MLSListing, Inc.
Property Information © 2025 MLSListings Inc. All rights reserved. Listing information is deemed reliable but not guaranteed. Certain information contained herein is derived from information which is the licensed property of, and copyrighted by, MLSListings Inc. The viewer acknowledges ownership and validity of its copyright. Information provided is for personal, non-commercial use by a viewer with a bona fide interest in the purchase or sale of real estate of the type being offered via this website or other electronic means. The viewer is prohibited from copying, redistributing or retransmitting any of the data or information provided by MLSListing, Inc.