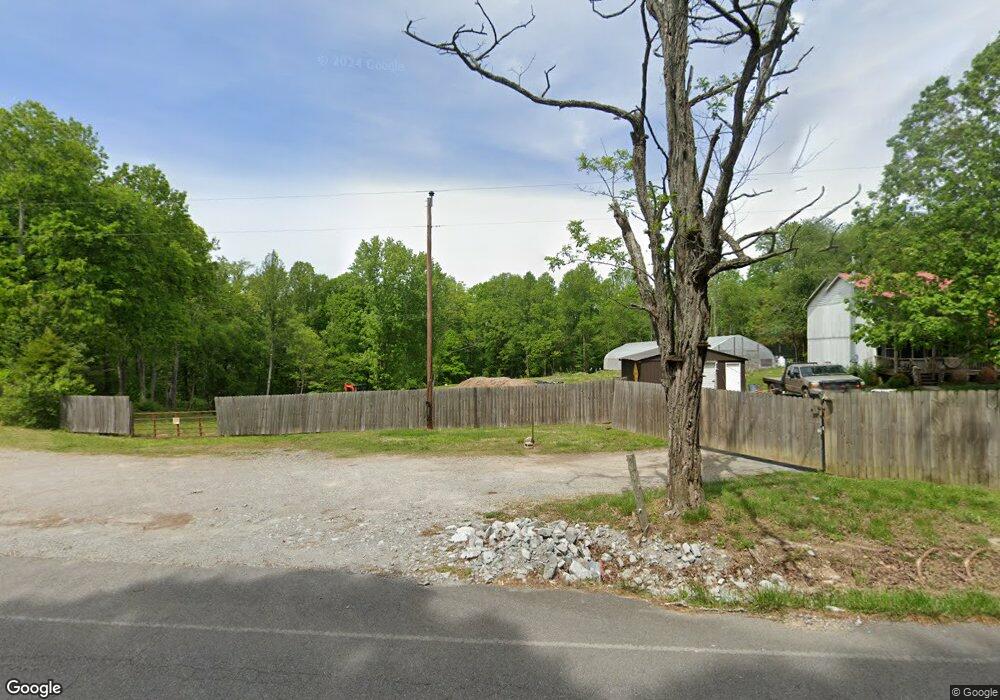
5852 Bending Chestnut Rd Franklin, TN 37064
Estimated Value: $94,000 - $794,000
--
Bed
1
Bath
1,730
Sq Ft
$292/Sq Ft
Est. Value
About This Home
This home is located at 5852 Bending Chestnut Rd, Franklin, TN 37064 and is currently estimated at $504,933, approximately $291 per square foot. 5852 Bending Chestnut Rd is a home located in Williamson County with nearby schools including Fairview Elementary School, Fairview Middle School, and Fairview High School.
Ownership History
Date
Name
Owned For
Owner Type
Purchase Details
Closed on
Aug 17, 2004
Sold by
Wm Specialty Mortgage Llc
Bought by
Turnbull Amy Marie and Turnbull Eric William
Current Estimated Value
Home Financials for this Owner
Home Financials are based on the most recent Mortgage that was taken out on this home.
Original Mortgage
$36,000
Outstanding Balance
$17,816
Interest Rate
5.97%
Mortgage Type
Purchase Money Mortgage
Estimated Equity
$487,117
Purchase Details
Closed on
Dec 11, 2003
Sold by
Baker Melanie A and Baker William E
Bought by
Wm Specialty Mortgage Llc
Purchase Details
Closed on
Jun 15, 1999
Sold by
Baker Clara Marie and Scott Clara Marie
Bought by
Baker William E and Baker Melanie A
Home Financials for this Owner
Home Financials are based on the most recent Mortgage that was taken out on this home.
Original Mortgage
$54,600
Interest Rate
7.13%
Create a Home Valuation Report for This Property
The Home Valuation Report is an in-depth analysis detailing your home's value as well as a comparison with similar homes in the area
Home Values in the Area
Average Home Value in this Area
Purchase History
| Date | Buyer | Sale Price | Title Company |
|---|---|---|---|
| Turnbull Amy Marie | $28,500 | Associates Closing & Title H | |
| Wm Specialty Mortgage Llc | $102,607 | -- | |
| Baker William E | -- | -- |
Source: Public Records
Mortgage History
| Date | Status | Borrower | Loan Amount |
|---|---|---|---|
| Open | Turnbull Amy Marie | $36,000 | |
| Previous Owner | Baker William E | $54,600 |
Source: Public Records
Tax History Compared to Growth
Tax History
| Year | Tax Paid | Tax Assessment Tax Assessment Total Assessment is a certain percentage of the fair market value that is determined by local assessors to be the total taxable value of land and additions on the property. | Land | Improvement |
|---|---|---|---|---|
| 2024 | $133 | $7,100 | $6,275 | $825 |
| 2023 | $133 | $7,100 | $6,275 | $825 |
| 2022 | $133 | $7,100 | $6,275 | $825 |
| 2021 | $133 | $7,100 | $6,275 | $825 |
| 2020 | $122 | $5,475 | $4,200 | $1,275 |
| 2019 | $270 | $12,150 | $4,200 | $7,950 |
| 2018 | $261 | $12,150 | $4,200 | $7,950 |
| 2017 | $261 | $12,150 | $4,200 | $7,950 |
| 2016 | $261 | $12,150 | $4,200 | $7,950 |
| 2015 | -- | $10,275 | $3,200 | $7,075 |
| 2014 | -- | $10,275 | $3,200 | $7,075 |
Source: Public Records
Map
Nearby Homes
- 5921 Beard Rd
- 5904 Davis Hollow Rd
- 5729 Natchez Trace Rd
- 5930 Parham Rd
- 6011 Garrison Springs Rd
- 5715 Greenbrier Rd
- 1 Peach Hollow Rd
- 0 Cobbler Ridge Rd Unit RTC3000852
- 0 Cobbler Ridge Rd Unit RTC3000845
- 3930 Mobley's Cut Rd
- 1 Cobbler Ridge Rd
- 5015 Cobbler Ridge Rd
- 5016 Cobbler Ridge Rd
- 5620 Leipers Creek Rd
- 5024 Cobbler Ridge Rd
- 6795 Leipers Creek Rd
- 5495 Leipers Creek Rd
- 6708 Leipers Creek Rd
- 5623 Pinewood Rd
- 6558 Leipers Creek Rd
- 5854 Bending Chestnut Rd
- 5851 Bending Chestnut Rd
- 5849 Bending Chestnut Rd
- 5864 Bending Chestnut Rd
- 5847 Bending Chestnut Rd
- 5845 Bending Chestnut Rd
- 5866 Bending Chestnut Rd
- 5872 Bending Chestnut Rd
- 5846 Bending Chestnut Rd
- 5841 Bending Chestnut Rd
- 5880 Bending Chestnut Rd
- 5828 Bending Chestnut Rd
- 5911 Beard Rd
- 5837 Bending Chestnut Rd
- 5915 Beard Rd
- 5907 Beard Rd
- 5910 Beard Rd
- 5905 Beard Rd
- 5929 Davis Hollow Rd
- 5892 Bending Chestnut Rd