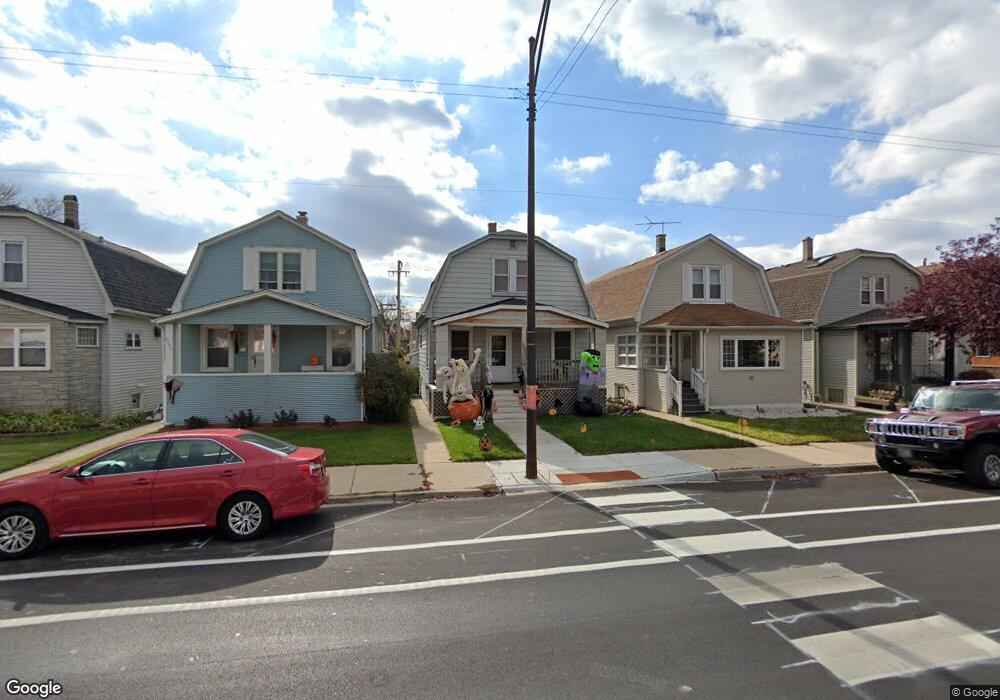
5890 N Elston Ave Chicago, IL 60646
Jefferson Park NeighborhoodEstimated Value: $381,000 - $436,334
3
Beds
3
Baths
1,188
Sq Ft
$354/Sq Ft
Est. Value
About This Home
This home is located at 5890 N Elston Ave, Chicago, IL 60646 and is currently estimated at $420,334, approximately $353 per square foot. 5890 N Elston Ave is a home located in Cook County with nearby schools including Hitch Elementary School, Taft High School, and St. Constance School.
Ownership History
Date
Name
Owned For
Owner Type
Purchase Details
Closed on
May 23, 2006
Sold by
Omalley Jodi Annett
Bought by
Kennedy Thomas W and Kennedy Debra L
Current Estimated Value
Home Financials for this Owner
Home Financials are based on the most recent Mortgage that was taken out on this home.
Original Mortgage
$244,800
Outstanding Balance
$143,071
Interest Rate
6.56%
Mortgage Type
Fannie Mae Freddie Mac
Estimated Equity
$277,263
Purchase Details
Closed on
Mar 14, 2003
Sold by
Gumiran Richard B
Bought by
Omalley Jodi Annett
Home Financials for this Owner
Home Financials are based on the most recent Mortgage that was taken out on this home.
Original Mortgage
$207,060
Interest Rate
5.95%
Mortgage Type
FHA
Purchase Details
Closed on
Jun 15, 2000
Sold by
Schuld Carl A and Schuld Kathleen E
Bought by
Omalley Jodi A and Gumiran Richard B
Home Financials for this Owner
Home Financials are based on the most recent Mortgage that was taken out on this home.
Original Mortgage
$149,521
Interest Rate
8.66%
Mortgage Type
FHA
Create a Home Valuation Report for This Property
The Home Valuation Report is an in-depth analysis detailing your home's value as well as a comparison with similar homes in the area
Home Values in the Area
Average Home Value in this Area
Purchase History
| Date | Buyer | Sale Price | Title Company |
|---|---|---|---|
| Kennedy Thomas W | $306,000 | Specialty Title | |
| Omalley Jodi Annett | -- | Cst | |
| Omalley Jodi A | $151,500 | -- |
Source: Public Records
Mortgage History
| Date | Status | Borrower | Loan Amount |
|---|---|---|---|
| Open | Kennedy Thomas W | $244,800 | |
| Previous Owner | Omalley Jodi Annett | $207,060 | |
| Previous Owner | Omalley Jodi A | $149,521 |
Source: Public Records
Tax History Compared to Growth
Tax History
| Year | Tax Paid | Tax Assessment Tax Assessment Total Assessment is a certain percentage of the fair market value that is determined by local assessors to be the total taxable value of land and additions on the property. | Land | Improvement |
|---|---|---|---|---|
| 2024 | $5,807 | $33,266 | $9,375 | $23,891 |
| 2023 | $6,088 | $30,821 | $7,504 | $23,317 |
| 2022 | $6,088 | $33,000 | $7,500 | $25,500 |
| 2021 | $5,970 | $33,003 | $7,503 | $25,500 |
| 2020 | $4,774 | $24,522 | $5,062 | $19,460 |
| 2019 | $4,788 | $27,247 | $5,062 | $22,185 |
| 2018 | $4,706 | $27,247 | $5,062 | $22,185 |
| 2017 | $5,050 | $26,819 | $4,500 | $22,319 |
| 2016 | $4,874 | $26,819 | $4,500 | $22,319 |
| 2015 | $4,436 | $26,819 | $4,500 | $22,319 |
| 2014 | $3,966 | $23,926 | $4,125 | $19,801 |
| 2013 | $3,876 | $23,926 | $4,125 | $19,801 |
Source: Public Records
Map
Nearby Homes
- 5906 N Mason Ave
- 5757 N Mason Ave
- 5956 N Elston Ave
- 6011 N Monitor Ave
- 5971 N Elston Ave Unit 1
- 5774 N Elston Ave
- 6035 N Mason Ave
- 5722 N Leonard Ave
- 5624 N Marmora Ave
- 5700 N Parkside Ave
- 5841 N Medina Ave
- 5620 N Major Ave
- 5657 N Parkside Ave
- 5700 N Central Ave
- 5859 N Melvina Ave
- 5883 N Central Ave
- 6117 N Meade Ave
- 6084 N Elston Ave
- 5706 N Moody Ave
- 5626 N Central Ave
- 5886 N Elston Ave
- 5892 N Elston Ave
- 5884 N Elston Ave
- 5896 N Elston Ave
- 5880 N Elston Ave
- 5898 N Elston Ave
- 5902 N Elston Ave
- 5854 N Markham Ave
- 5904 N Elston Ave
- 5918 W Thorndale Ave
- 5852 N Markham Ave
- 5926 W Thorndale Ave
- 5893 N Elston Ave
- 5928 W Thorndale Ave
- 5908 N Elston Ave
- 5891 N Elston Ave Unit 2
- 5848 N Markham Ave
- 5932 W Thorndale Ave
- 5901 N Elston Ave Unit 2