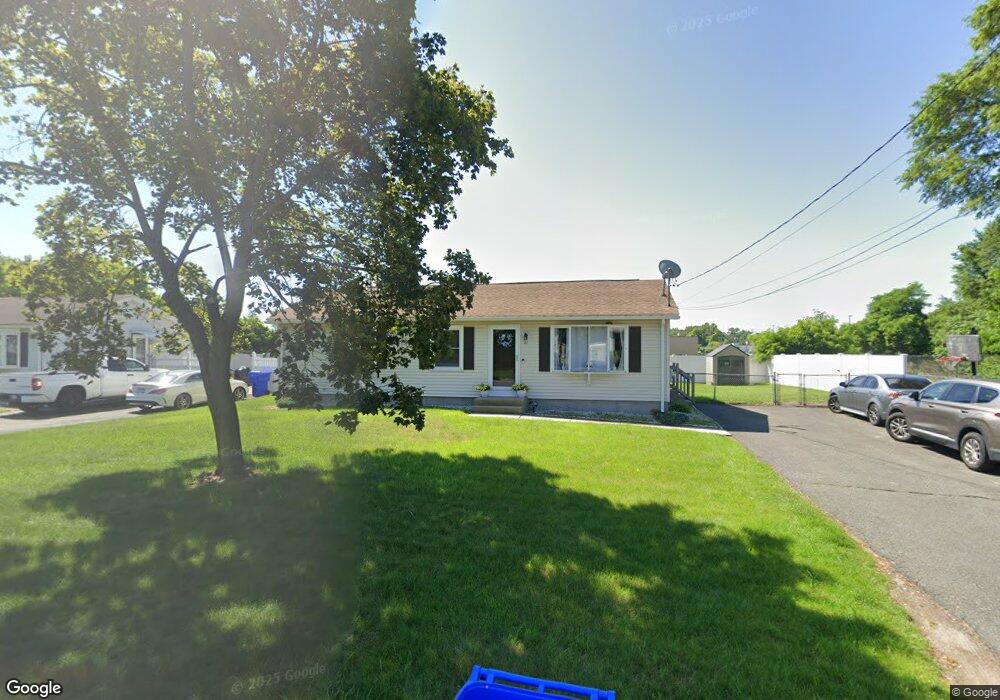
59 Newport St Springfield, MA 01119
Boston Road NeighborhoodEstimated Value: $314,000 - $339,000
3
Beds
2
Baths
1,756
Sq Ft
$184/Sq Ft
Est. Value
About This Home
This home is located at 59 Newport St, Springfield, MA 01119 and is currently estimated at $323,161, approximately $184 per square foot. 59 Newport St is a home located in Hampden County with nearby schools including Frank H. Freedman School, John F. Kennedy Academy, and Springfield Central High School.
Ownership History
Date
Name
Owned For
Owner Type
Purchase Details
Closed on
Oct 17, 2000
Sold by
Dejesus Matilde
Bought by
Johnson Ernest J and Johnson Lisa J
Current Estimated Value
Home Financials for this Owner
Home Financials are based on the most recent Mortgage that was taken out on this home.
Original Mortgage
$90,200
Outstanding Balance
$32,824
Interest Rate
7.89%
Mortgage Type
Purchase Money Mortgage
Estimated Equity
$290,337
Create a Home Valuation Report for This Property
The Home Valuation Report is an in-depth analysis detailing your home's value as well as a comparison with similar homes in the area
Home Values in the Area
Average Home Value in this Area
Purchase History
| Date | Buyer | Sale Price | Title Company |
|---|---|---|---|
| Johnson Ernest J | $93,500 | -- |
Source: Public Records
Mortgage History
| Date | Status | Borrower | Loan Amount |
|---|---|---|---|
| Open | Johnson Ernest J | $90,200 |
Source: Public Records
Tax History
| Year | Tax Paid | Tax Assessment Tax Assessment Total Assessment is a certain percentage of the fair market value that is determined by local assessors to be the total taxable value of land and additions on the property. | Land | Improvement |
|---|---|---|---|---|
| 2025 | $3,522 | $224,600 | $45,200 | $179,400 |
| 2024 | $3,557 | $221,500 | $42,300 | $179,200 |
| 2023 | $3,362 | $197,200 | $40,300 | $156,900 |
| 2022 | $3,030 | $161,000 | $40,300 | $120,700 |
| 2021 | $3,086 | $163,300 | $36,600 | $126,700 |
| 2020 | $2,687 | $137,600 | $36,600 | $101,000 |
| 2019 | $2,722 | $138,300 | $36,600 | $101,700 |
| 2018 | $2,541 | $129,100 | $36,600 | $92,500 |
| 2017 | $2,524 | $128,400 | $36,600 | $91,800 |
| 2016 | $2,430 | $123,600 | $36,600 | $87,000 |
| 2015 | $2,486 | $126,400 | $36,600 | $89,800 |
Source: Public Records
Map
Nearby Homes
Your Personal Tour Guide
Ask me questions while you tour the home.