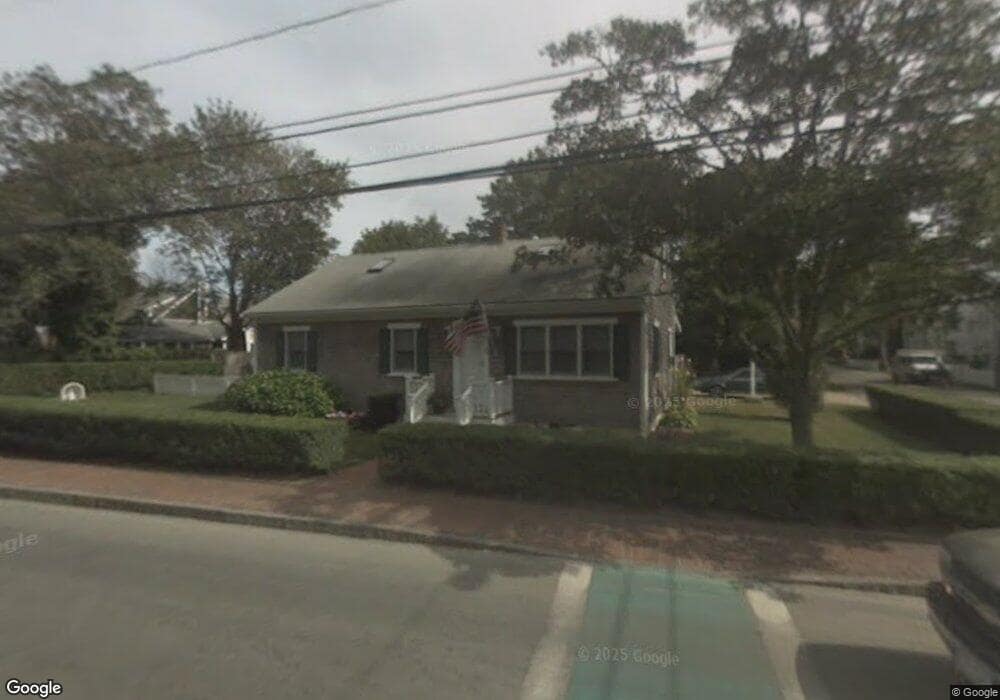
59 Peases Point Way S Edgartown, MA 02539
Edgartown NeighborhoodEstimated Value: $3,525,000 - $3,878,000
5
Beds
4
Baths
2,923
Sq Ft
$1,246/Sq Ft
Est. Value
About This Home
This home is located at 59 Peases Point Way S, Edgartown, MA 02539 and is currently estimated at $3,640,983, approximately $1,245 per square foot. 59 Peases Point Way S is a home located in Dukes County with nearby schools including Edgartown Elementary School and Martha's Vineyard Regional High School.
Ownership History
Date
Name
Owned For
Owner Type
Purchase Details
Closed on
Jan 8, 2021
Sold by
J A Bettencourt 2015 T
Bought by
Wanda M Williams T
Current Estimated Value
Purchase Details
Closed on
Apr 19, 2016
Sold by
Judith A Bettencourt T
Bought by
Wanda M Williams T
Purchase Details
Closed on
Jul 26, 2012
Sold by
Bettencourt Judith A
Bought by
Judith A Bettencourt T
Purchase Details
Closed on
Jan 4, 2012
Sold by
Stanton Rt
Bought by
Bettencourt Judith A
Home Financials for this Owner
Home Financials are based on the most recent Mortgage that was taken out on this home.
Original Mortgage
$405,000
Interest Rate
4%
Purchase Details
Closed on
Nov 6, 2006
Sold by
Bettencourt Leonora P
Bought by
Bettencourt Judith and Stanton Norma
Purchase Details
Closed on
Aug 9, 2006
Sold by
Stanton Norma B and Stanton Richard J
Bought by
Stanton Tr Norma B and Stanton Richard J
Purchase Details
Closed on
Aug 4, 2006
Sold by
Stanton Norma B
Bought by
Stanton Tr Norma B and Stanton Richard J
Create a Home Valuation Report for This Property
The Home Valuation Report is an in-depth analysis detailing your home's value as well as a comparison with similar homes in the area
Home Values in the Area
Average Home Value in this Area
Purchase History
| Date | Buyer | Sale Price | Title Company |
|---|---|---|---|
| Wanda M Williams T | -- | None Available | |
| Wanda M Williams T | -- | -- | |
| Judith A Bettencourt T | -- | -- | |
| Bettencourt Judith A | -- | -- | |
| Bettencourt Judith | -- | -- | |
| Stanton Tr Norma B | -- | -- | |
| Stanton Tr Norma B | -- | -- |
Source: Public Records
Mortgage History
| Date | Status | Borrower | Loan Amount |
|---|---|---|---|
| Previous Owner | Bettencourt Judith A | $405,000 | |
| Previous Owner | Bettencourt Judith A | $405,000 |
Source: Public Records
Tax History Compared to Growth
Tax History
| Year | Tax Paid | Tax Assessment Tax Assessment Total Assessment is a certain percentage of the fair market value that is determined by local assessors to be the total taxable value of land and additions on the property. | Land | Improvement |
|---|---|---|---|---|
| 2025 | $6,375 | $2,405,700 | $1,102,800 | $1,302,900 |
| 2024 | $5,685 | $2,229,500 | $1,102,800 | $1,126,700 |
| 2023 | $5,356 | $2,125,300 | $1,063,900 | $1,061,400 |
| 2022 | $5,212 | $1,720,200 | $1,050,300 | $669,900 |
| 2021 | $5,494 | $1,674,900 | $1,054,000 | $620,900 |
| 2020 | $5,502 | $1,642,300 | $1,054,000 | $588,300 |
| 2019 | $5,876 | $1,518,300 | $930,000 | $588,300 |
| 2018 | $4,531 | $1,391,500 | $903,800 | $487,700 |
| 2017 | $4,384 | $1,234,900 | $747,100 | $487,800 |
| 2016 | $4,281 | $1,182,700 | $747,100 | $435,600 |
| 2015 | $3,879 | $1,118,000 | $665,000 | $453,000 |
Source: Public Records
Map
Nearby Homes
- 11 Norton St
- 43 Peases Point Way S
- 69 School St
- 52 S Summer St
- 10 Tilton Way
- 8 High St
- 48 W Tisbury Rd
- 48 Edgartown - West Tisbury Rd
- 10 Peases Point Way N
- 23 Pinehurst Rd
- 62 N Summer St
- 25 Dock St
- 26 Curtis Ln
- 68 N Water St
- 76 Norton Orchard Rd
- 7 Clark Dr
- 43 Cottage St
- 5 Louis Field Rd
- 5 Louis Field Rd Unit 121.3
- 2 Orchard Ln