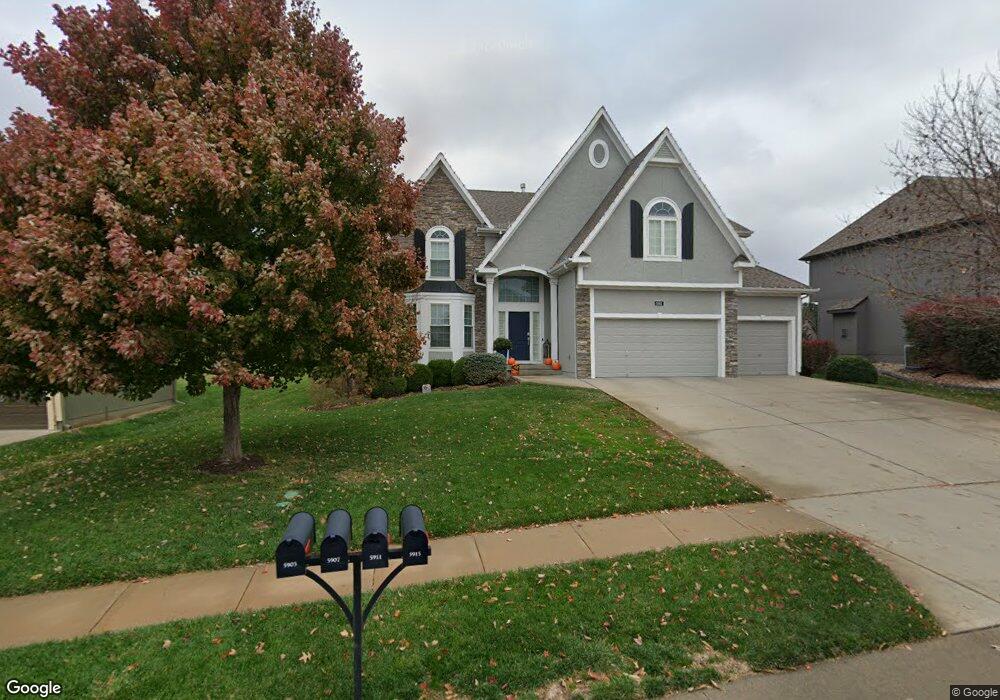
5911 Mccoy St Shawnee, KS 66226
Estimated Value: $651,866 - $717,000
5
Beds
6
Baths
3,027
Sq Ft
$225/Sq Ft
Est. Value
About This Home
This home is located at 5911 Mccoy St, Shawnee, KS 66226 and is currently estimated at $681,717, approximately $225 per square foot. 5911 Mccoy St is a home located in Johnson County with nearby schools including Prairie Ridge Elementary School, Monticello Trails Middle School, and Mill Valley High School.
Ownership History
Date
Name
Owned For
Owner Type
Purchase Details
Closed on
Jul 29, 2011
Sold by
Dean Allen H and Dean Stephanie E
Bought by
Dean Allen H and Dean Stephanie E
Current Estimated Value
Purchase Details
Closed on
Feb 22, 2007
Sold by
True Builders Inc
Bought by
Dean Allen H and Dean Stephanie E
Home Financials for this Owner
Home Financials are based on the most recent Mortgage that was taken out on this home.
Original Mortgage
$38,200
Outstanding Balance
$22,892
Interest Rate
6.26%
Mortgage Type
Stand Alone Second
Estimated Equity
$658,825
Purchase Details
Closed on
Sep 29, 2006
Sold by
Grey Oaks Llc
Bought by
True Builders Inc
Home Financials for this Owner
Home Financials are based on the most recent Mortgage that was taken out on this home.
Original Mortgage
$298,000
Interest Rate
6.47%
Mortgage Type
Future Advance Clause Open End Mortgage
Create a Home Valuation Report for This Property
The Home Valuation Report is an in-depth analysis detailing your home's value as well as a comparison with similar homes in the area
Home Values in the Area
Average Home Value in this Area
Purchase History
| Date | Buyer | Sale Price | Title Company |
|---|---|---|---|
| Dean Allen H | -- | None Available | |
| Dean Allen H | -- | First American Title Ins Co | |
| True Builders Inc | -- | First American Title Insuran |
Source: Public Records
Mortgage History
| Date | Status | Borrower | Loan Amount |
|---|---|---|---|
| Open | Dean Allen H | $38,200 | |
| Open | Dean Allen H | $305,750 | |
| Previous Owner | True Builders Inc | $298,000 |
Source: Public Records
Tax History Compared to Growth
Tax History
| Year | Tax Paid | Tax Assessment Tax Assessment Total Assessment is a certain percentage of the fair market value that is determined by local assessors to be the total taxable value of land and additions on the property. | Land | Improvement |
|---|---|---|---|---|
| 2024 | $7,549 | $64,630 | $12,893 | $51,737 |
| 2023 | $7,546 | $64,101 | $12,282 | $51,819 |
| 2022 | $6,950 | $57,856 | $11,702 | $46,154 |
| 2021 | $6,789 | $54,464 | $10,636 | $43,828 |
| 2020 | $6,522 | $51,842 | $10,636 | $41,206 |
| 2019 | $6,318 | $49,485 | $9,666 | $39,819 |
| 2018 | $6,287 | $48,806 | $8,788 | $40,018 |
| 2017 | $6,446 | $48,829 | $7,645 | $41,184 |
| 2016 | $6,678 | $49,979 | $7,645 | $42,334 |
| 2015 | $6,559 | $48,093 | $7,645 | $40,448 |
| 2013 | -- | $44,194 | $7,645 | $36,549 |
Source: Public Records
Map
Nearby Homes
- 24621 W 60th St
- 22310 W 58th St
- 22209 W 57th St
- 22605 W 56th St
- 5531 Hilltop Dr
- 5722 Payne St
- 5408 Aminda St
- 6358 Hilltop St
- 5625 Meadow View Dr
- 5402 Roundtree St
- 22429 W 64th St
- 21609 W 61st St
- 6031 Lakecrest Dr
- 21624 W 53rd Terrace
- 21315 W 56th St
- 22213 W 64th Terrace
- 21309 W 56th St
- 6122 Lewis Dr
- 6118 Lewis Dr
- 6114 Lewis Dr
- 5907 Mccoy St
- 5915 Mccoy St
- 5903 Mccoy St
- 22420 W 59th Terrace
- 5914 Mccoy St
- 22603 W 59th St
- 5833 Mccoy St
- 22416 W 59th Terrace
- 5931 Hilltop Dr
- 22415 W 59th St
- 22411 W 59th St
- 5932 Hilltop Dr
- 5829 Mccoy St
- 22419 W 59th St
- 22407 W 59th St
- 22412 W 59th Terrace
- 5935 Hilltop Dr
- 22607 W 59th St
- 5929 Mccoy St
- 22602 W 59th St